Premise: The competitive environment surrounding the Public Cloud is in flux. SaaS remains turbulent with new entrants successfully gaining share and incumbent licensed software providers trying to develop SaaS offerings and reclaim leadership positions they have maintained for a decade or more. The IaaS segment leadership is beginning to crystalize as a function of scale, but PaaS is just formulating and finding its way. As such, enterprises need to be wary of which providers are winning and losing (and where), but more importantly what they themselves intend to accomplish with Public Cloud.
See the companion Wikibon research Public Cloud Market Forecast 2015-2026
Wikibon believes that applications and business processes are the key sources of value in IT. This is no different with Public Cloud offerings. SaaS is exploding in many directions and is gaining maturity and traction in cross industry business solutions (Finance, Sales, Marketing, HCM, and Supply Chain). Leveraging PaaS is important for enterprises in extending the core value of the application functionality to industry and enterprise-specific workflows. This sort of customization is what is missing in the core SaaS offering and PaaS platforms make this possible. IaaS is helping to commoditize IT business processes and budget, while PaaS offers a means to create or extend business process value.
There are several important factors in selecting Public Cloud partners:
- Solution quality
- Related business (or IT or AppDev) process compatibility
- Breadth and depth of offerings
- Incumbent relationships
- Pricing
- Individual enterprise’s risk:reward tolerance
While it may be too early in the market evolution for enterprises to be making exclusive bets with any one cloud provider, Wikibon believes that every enterprise should be deploying Public Cloud for appropriate workloads. Beginning that strategy now will enable IT organizations to gain experience with Public Cloud technology and its economics, and strategically prepare themselves for the cloud journey that lies ahead.
Public Cloud Overview
Public Cloud offerings span the entire IT solution space from hosted applications (SaaS) to application development (PaaS) to infrastructure (IaaS). Beyond a handful of market leaders, most cloud providers participate meaningfully in only one of these segments. While the near-term Public Cloud will continue to be dominated by SaaS offerings, IaaS and PaaS will be growing faster throughout the next decade when SaaS will begin to reach the asymptote of the historical growth rate of application software.
The longer-term challenge for SaaS will be the ability of existing software application vendors to re-platform their offerings to the Public Cloud model, especially in terms of delivering more value to support vertical market-specific and complex and large scale applications (including industry-specific, in-line analytics and customization for enterprise-specific solutions).
IaaS offerings continue to improve and offer disruptive alternatives to enterprise data center, outsourcing, and hosting alternatives. However, the latter 3rd party offerings of complete infrastructure management as well as customized solutions will continue to be appealing to many enterprises, even while they select IaaS for selected infrastructure functions.
The benefit of PaaS is that development and maintenance of applications and infrastructure can be significantly simplified, providing faster time to value. This is a key value-added to the core SaaS offer and the opportunity to deepen customer relationships with standardized offerings.
Software-as-a-Service Market
The Public Cloud SaaS market will grow from $56B in 2014 to $493B by 2026, 18% compounded annually, accounting for 42% of all application software spending by 2026. Software overall will increasingly be the focus of business value delivered by information technology. This trend can be seen in the development of complementary Public Cloud offerings for core ERP products by the leading license vendors (Oracle and SAP) as well as application exchanges. Growth will remain steady and strong through 2026 – but SaaS will begin to near its asymptote of overall application software growth (~5-10% annually).
Source: Wikibon 2015 (see Appendix A for methodology)
The Public Cloud SaaS market today is very fragmented with 100s of participants in most segments of the application software market – including cross industry ERP apps, productivity apps, and some select vertical industry offerings. Like the license-based application software market today, this segment will have a high degree of fragmentation going forward. Wikibon projects that cross-industry ERP and Productivity apps will be the leading segments of SaaS going forward.
Source: Wikibon 2015
Cross-Industry Business Applications
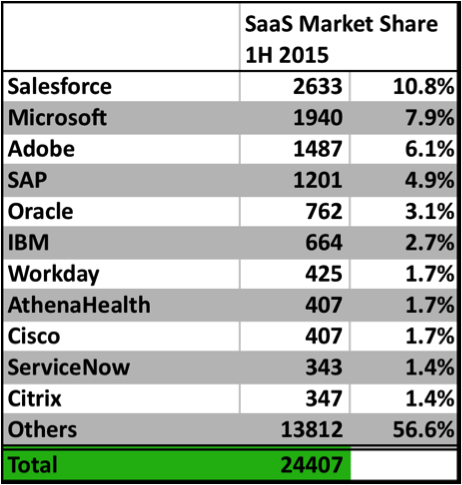
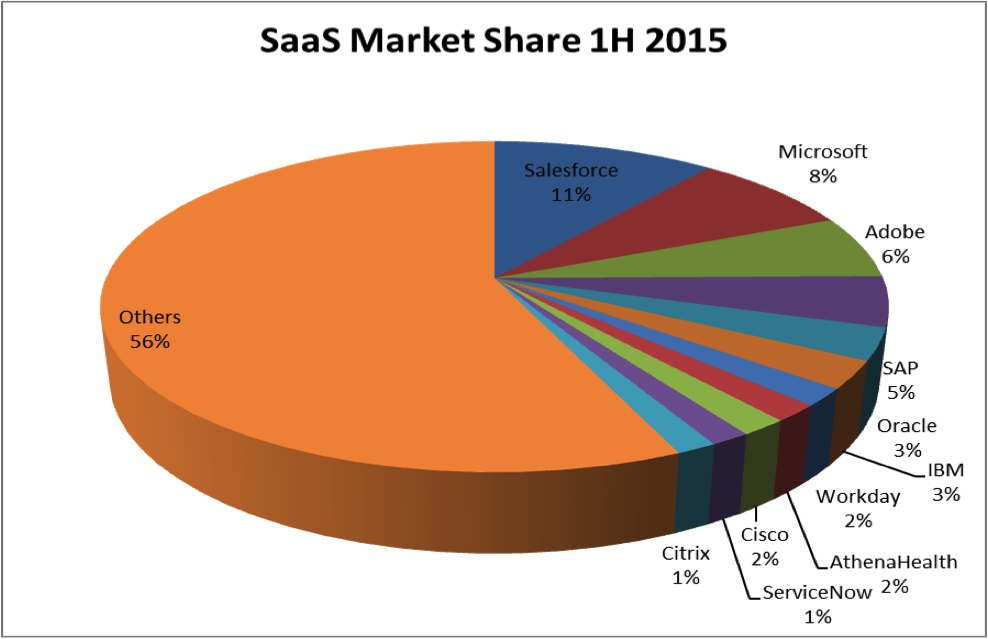
Cross-Industry Business Applications (Sales and Marketing, Financials, HCM, Supply Chain, and CRM) are the strongest SaaS segment. Salesforce is the leader today with 11% of the SaaS market as it has leveraged its Sales Cloud leadership into Marketing, HCM, and CRM – and more recently data analytics, social, and a foray into verticalizing their CRM platform for the Finance industry. They should continue to be successful.
For the licensed software leaders (SAP (5%) and Oracle (3%)), acquisitions have been a big part of their growth in SaaS. However, their existing software business models and the potential for disruption for their large enterprise clients are barriers for them to gain share. Their Public Cloud strategy will be for gradual, low impact migrations involving private and hybrid as well as Public Cloud offerings.
On the other hand, Microsoft is migrating its Dynamics offering aggressively to the Public Cloud. The concentration of their business in the SMB sector where standardization and low relative solution complexity is facilitating this transition.
Productivity Applications
The Productivity segment (office, content management, communications, etc.) has very low barriers to entry and therefore many participants. Consumer-oriented services such as DropBox and Box.net are being adopted by enterprises as inexpensive, good-enough solutions to content management and communications. Microsoft has been doubling the growth of Office 365 adoption year-over-year in enterprises as well as with consumers. Together with its Dynamics offering, Microsoft accounts for 8% of the SaaS market. The growth here has continued unabated for many quarters, and there appears to be a significant amount of migration potential remaining.
Adobe (6%) with its Marketing and Creative Cloud offerings plays in both the Cross Industry and the Productivity segments.
Small, But Growing Rapidly
IBM acquisitions over the past few years have them at a 3% SaaS share, but they are not trying to transform an incumbent license application software portfolio. Workday (2%) and ServiceNow (1%) have formidable offerings in the CRM and HCM segments today and are growing very rapidly. Athenahealth (2%) is unique among the Top 10 in SaaS as an industry-specific (Health Care) offering. Cisco (2%) and Citrix (1%) have well established offerings in the Public Cloud conferencing and communications space.
Platform-as-a-Service Market
The Public Cloud PaaS market will grow from $1.7B to $68.3B by 2026, 36% compounded annually. Today, it is in the very early stages of its maturity. Wikibon defines PaaS narrowly as an overall architecture that manages applications and application suites from cradle to grave Wikibon Platform-as-a-Service PaaS Topology. It does so by using micro-services from the application to manage the resources at lower levels of the stack. The benefit of this approach is that development and maintenance of applications and infrastructure can be significantly simplified, providing faster time to business value. It is an ideal environment for DevOps, as the PaaS platform manages the lower infrastructure levels.
Many of the leading Public Cloud SaaS offerings also have PaaS tools to extend the usefulness of their core offerings. Smart users are figuring out how to use the tools of Amazon Elastic Beanstalk, Salesforce Heroku and Force.com, etc. to extend the functionality and value of the core Public Cloud offering and realize the potential of the public cloud to deliver enterprise-specific, real-time upgrades to their business processes. In the end, the critical business processes that define an enterprise and dictate its success, are the areas where enterprises need to be focusing their public cloud attention.
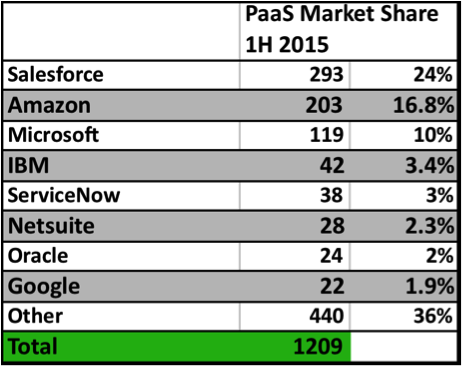
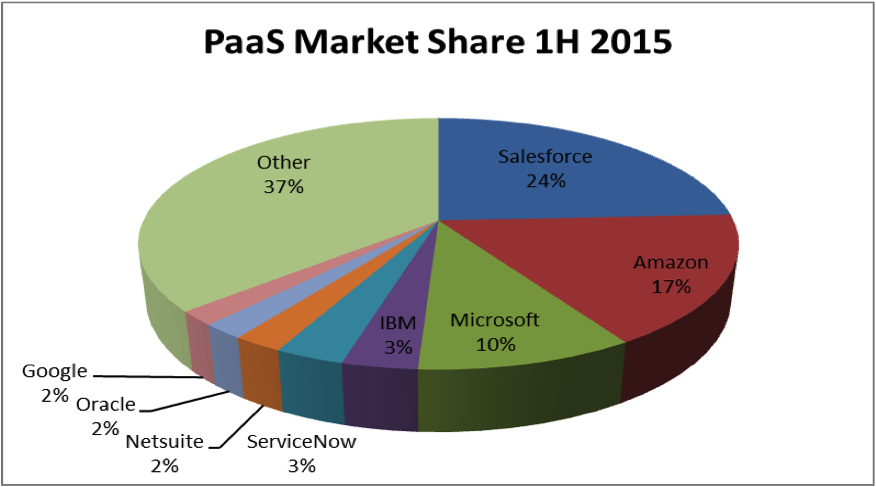
There are two types of Public Cloud PaaS – PaaS on IaaS and PaaS on SaaS. PaaS on IaaS includes offerings like Amazon’s Elastic Beanstalk and Pivotal Web Services (based on Cloud Foundry). PaaS on SaaS includes offerings like Force.com on Salesforce, and the ServiceNow PaaS extensions. As a result of our narrow application-focused definition of PaaS, Wikibon’s forecast is that PaaS will remain a low percentage of the Public Cloud (specifically IaaS) for some time, but will grow as the PaaS platforms mature and SaaS gains more traction. Besides enabling greater customization for what is essentially a standardized product, PaaS on SaaS enables providers to strengthen relationships with their customers and can help lock them in.
Overall, Salesforce.com (24%), Amazon (17%), and Microsoft (10%) are the leaders in PaaS today.
Source: Wikibon 2015 (see Appendix A for methodology)
In the PaaS on IaaS space, Amazon’s Elastic Beanstalk is the leader, offering a set of micro-services including database and storage options such as Amazon RDS, Amazon DynamoDB, Amazon SimpleDB, Microsoft SQL Server, Oracle, IBM DB2, and Informix. Wikibon believes that Amazon will invest significantly in Elastic Beanstalk, and will rapidly improve the micro-services. These improvements will include support for MySQL and derivatives, and all other databases except (probably) Oracle which will protect its own IaaS database service.
Large enterprises have the skills and experience to adopt and leverage PaaS on IaaS (e.g., Pivotal Web Services, IBM Bluemix, CenturyLink AppFog), but it may be too complex for Small and Medium businesses, so could have limited business value for these users. Big Data and analytics (especially in-line analytics) may be a significant high growth application for PaaS on IaaS, but it’s still early days for that market.
Source: Wikibon 2015
Infrastructure-as-a-Service Market
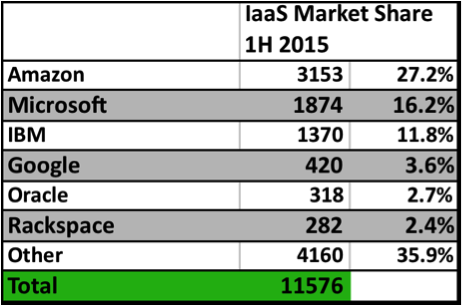
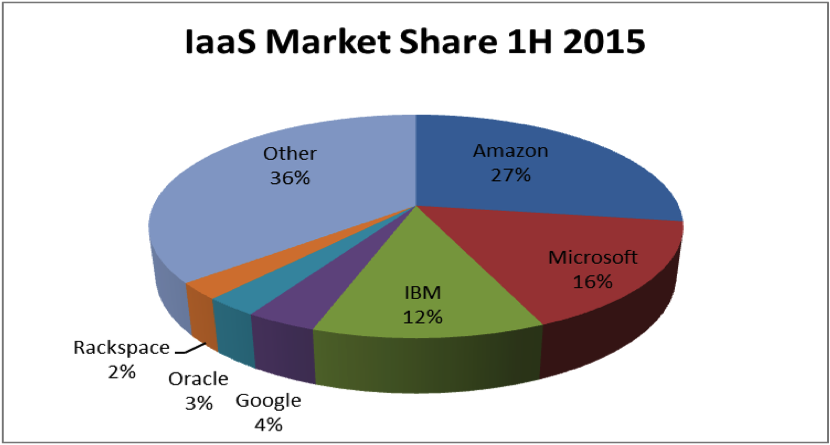
The Public Cloud IaaS market will grow from $15.1B in 2014 to $126.2B by 2026, 19% compounded annually, accounting for 25% of all infrastructure hardware, software, and services spending. In the latter part of the forecast period, IaaS will increasingly be absorbed into PaaS usages.
Amazon (27%) is the leader in this segment, followed by Microsoft Azure (16%), IBM (12%), and Google (4%). Scale and access to capital are the key factors that spell success in what is essentially a commodity market. Scale enables the investment required to drive volume and pricing, and Amazon and Microsoft stand out on this dimension of IaaS. Amazon and Microsoft stand out in terms of the breadth and depth of its offerings and its ecosystem. Microsoft stands out on breadth and depth of it’s offerings. IBM has the advantage of being able to draw on its many enterprise accounts. Google and Amazon are the price leaders. Obviously, another key attribute of IaaS offerings is their reliability, consistency, and both latency and capacity management that align with specific workload requirements. The successful IaaS provider needs to offer an attractive environment for SaaS vendors, while offering global and highly localized services for enterprises. The scale and ability to set the technical and pricing cadence of the market are important attributes of leadership and Amazon and Microsoft appear well positioned to continue to drive the market forward and raise significant barriers to head-on-head entries.
Source: Wikibon 2015 (see Appendix A for methodology)
While scale and capital access are the key success factors, there are other factors users should consider in selecting an IaaS partner. Brand trust and ecosystem are important for many users – especially for enterprises planning on a rich mix of private and hybrid cloud as their IT strategy. Microsoft’s ubiquity and its Office 365, Dynamics, Active Directory, etc. assets may be appealing to many users who value compatibility with their current Data Center and business processes. In a recent Wikibon survey of IaaS users, IBM scored higher on the dimension of “Trust” than other IaaS providers. IBM’s mission critical business process acumen, ability to embrace complexity, and data analytics skills may draw customers (especially large ones) that need this sort of infrastructure-enabled depth and breadth. Google draws a lot of interest from SMBs seeking simplicity.
While IaaS leadership seems to be confined to 3-4 providers at this time, the IaaS competitive landscape is far from determined. Managed infrastructure hosters like CenturyLink (Savvis), Verizon, Fujitsu, Dimension Data, Interroute, AT&T, EMC/Virtustream offer a mix of traditional infrastructure hosting, private cloud, colocation services, and Public Cloud for some services. Some providers like VMware vCloud Air and HP Helion are focusing on hybrid solutions with some Public Cloud components. Offerings from Cloud arms merchants like HP, EMC/VMware, and Cisco will enable their partners to furnish cloud-ready offerings to SMBs and industry-specific solution providers.
Wikibon Public Cloud Guidance
In Public Cloud, as in horseracing, there are “Horses for Courses”. There are many entry points into Public Cloud, and enterprises should be considering how to leverage SaaS, Paas, and IaaS. There are leaders today in each segment, but every enterprise should be considering where Public Cloud fits in their strategy in the future. There are obvious low-hanging fruit opportunities (i.e., Productivity) but enterprises should be planning and deploying public cloud to maximize business, IT, and development processes and value.
While the markets today appear to be pretty diffuse Public Cloud is a rapidly growing delivery technology that will continue to disrupt nearly every traditional IT market. An enterprise’s choice of Public, Private, and/or Hybrid clouds will depend on many factors – primarily workload requirements. For Public Cloud, Line of Business executives will control more of their IT-driven business processes. IT executives will look continue to offload as many routine IT functions as practicable to the public cloud. App developers will use the public cloud to rapidly extend current apps and create new ones that will impact business processes and value. Enterprise actors – both business and IT – need to be actively engaging about how to leverage the Public Cloud today.
Source: Wikibon 2015
Appendix A – Methodology
Wikibon Public Cloud Forecast Methodology
A famous economist once said, “If you don’t forecast well, then you should forecast often.” Given the turbulence that Cloud is creating in the IT Market today, the Wikibon methodology takes this advice seriously. This forecast is based on a variety of interlocking inputs and points of calibration and can be updated quarterly to reflect changing market conditions.
Public Cloud Sizing and Forecast Methodology
Wikibon has drawn on a wide variety of sources to establish this Public Cloud Sizing, Segmentation, and Forecast.
- Worldwide Cloud Spending Sizing and Forecast – Our growth and penetration rates for Cloud for each segment are built up from reported revenue of ~100 lines of business for cloud providers. In some cases, Wikibon analysts have applied intelligent estimates where the vendor is important and the published data is ambiguous. This approach has been made easier over the past year as many more of the largest vendors are reporting Cloud revenue.
- Sizing Cloud Segment Revenue – Wikibon has conducted surveys of Cloud users to gauge the applications and use cases. We have applied this data to our working revenue models to calibrate the segments where spending is strong today and where users are intending to expand their cloud use cases and spending in the future.
- Wikibon Expert Analysis – Most importantly, Wikibon has drawn on its expert analysts to calibrate the near term data and to create a vision of where the cloud market is heading based on their knowledge of users, vendors, and the technology evolution that will continue to press Cloud into more and more varied usage scenarios.
- Underlying Worldwide IT Spending Forecast – Lastly, our growth and penetration rates are calibrated against a WW IT Spending market model that is based on publicly reported quarterly financial data and a protocol of statistical trend analyses to estimate the likeliest revenue outcomes for the forecast period for each of ~ 150 vendors and reported business units (in the aggregate covering 45% of all WW IT spending). The approach assumes that — in the aggregate — leading vendor financial reports provide good guidance for the market’s overall growth rate. The data is weighted and aggregated for each IT industry segment within which Cloud spending occurs so as to ensure our growth rates make sense in terms of rates and degree of penetration vs. available spending.
This approach enables our forecasts to incorporate up-to-the-minute, auditable data to maintain running forecasts that can be recalibrated to reflect new information and real market trends.
Appendix B – Public Cloud Vendor Revenue Detail
Public Cloud Market Leaders IH 2014, 2H 2014, 1H 2015 and Year-over-year Growth Rates
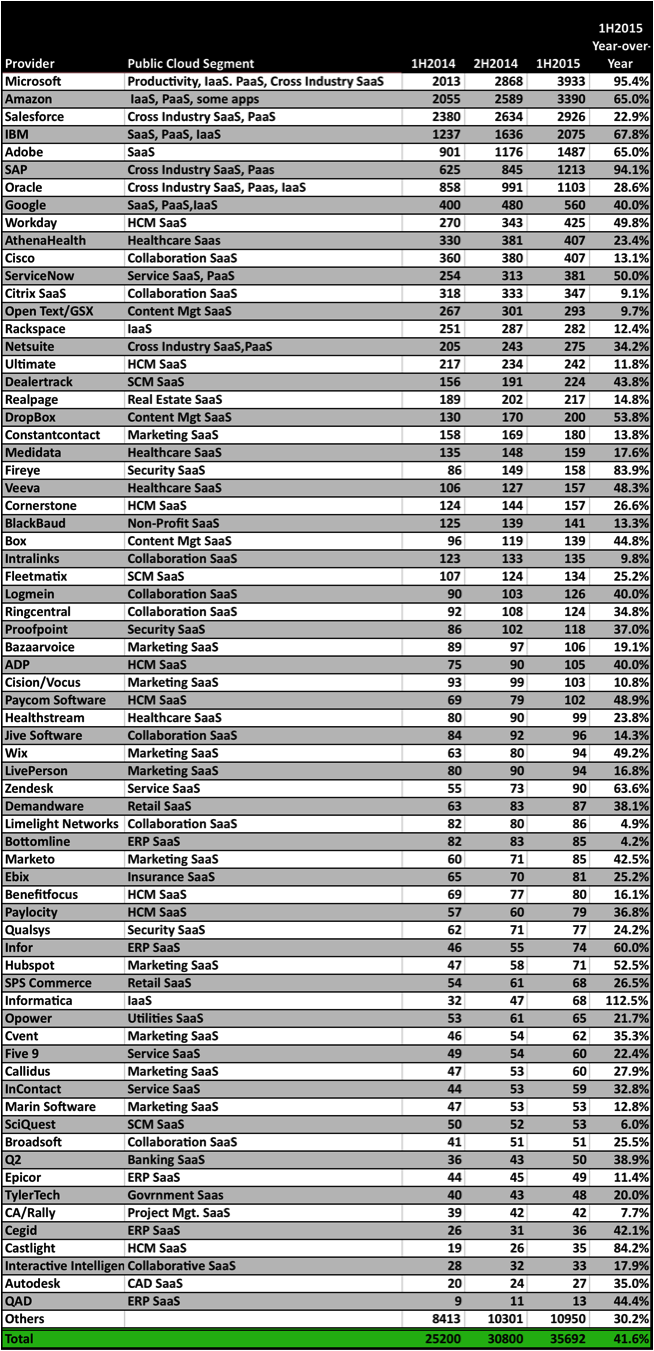
Source: Wikibon 2015
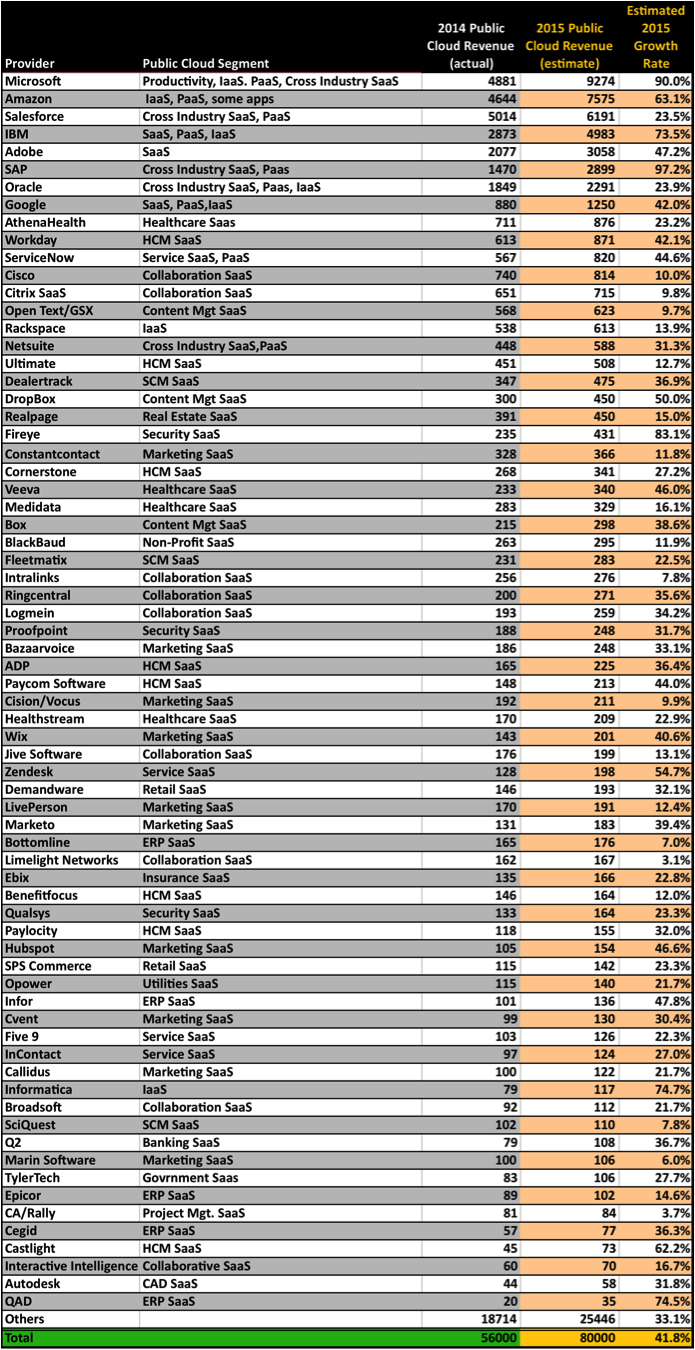
Public Cloud Market Leaders 2014 Actuals, 2015 Full Year Estimates and Year-over-year Growth Rates
The 2015 revenue data is Wikibon’s best estimate for how 2015 will look by year’s end. They based on Wikibon models and do not reflect any guidance or input from any of the providers. In addition, the Public Cloud market has proven to be volatile over the past year, especially among the leaders, but we believe these are the likeliest outcomes.
Source: Wikibon 2015