Introduction
Have you ever seen a manager succeed in taking away an employee’s Macbook Air and replacing it with a traditional hard disk PC? Or tried to migrate application users from a flash-only array to a cheaper traditional hard disk (HDD) array? Have you ever had to remember to save your work on a flash-based iPhone?
Users know that fast and consistent system response times from any device, application or system they are using improves their individual productivity. DBAs and storage administrators know that the vast majority of systems with very fast storage run better and take less time to manage. Moreover, flash provides more productive ways of designing systems, e.g., continuous saving of every keystroke is impossible with hard disk PCs, but is the norm in flash-based mobile devices. And of course, when there is an IT problem, storage is generally the culprit until proven otherwise.
The objective of this research is to help executives justify faster storage, both from an IT budget and an application user productivity perspective.
Impact of Flash on IT Infrastructure Costs
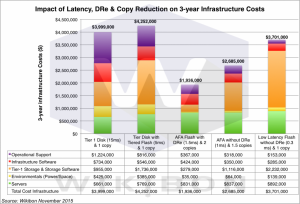
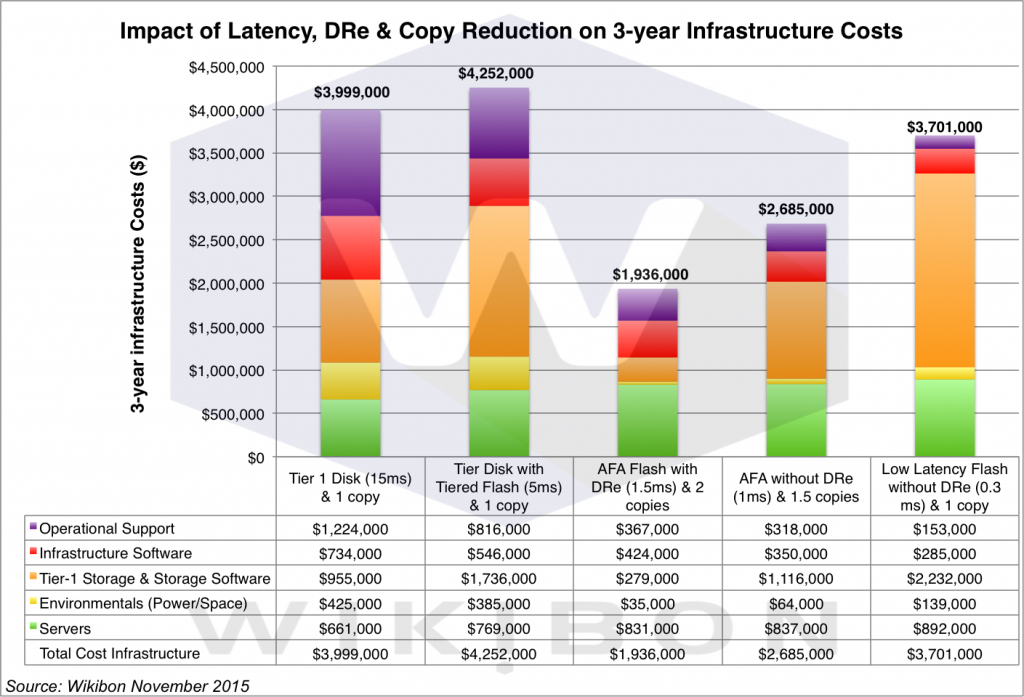
Figure 1 below shows the impact of low and consistent latency on infrastructure costs with the bars representing five configurations, each with different latencies:
- Tier 1 Disk with 15ms average response time. This is a traditional tier 1 array. The 15 ms average response time masks the fact that there are many very long IO response times, because on the nature of HDDs. In workloads with IO dependencies (e.g., a lock issued or released), the impact of a long IO response time can propagate to all the other IOs in the chain. Of course, benchmarks carefully remove most IO dependencies, but this is not possible in the real world. As a result, in most environments servers have significant amounts of IO wait-time, requiring more servers, which in turn increases the cost of infrastructure software. Since each HDD has limited IO and bandwidth, and systems are constantly changing, operational support is highest when latencies are longest. The assumption of the number of copies is 1, as the characteristics of HDD make it very difficult to share & update one copy of physical data from many logical copies.
- Tier 1 Disk with Tiered Flash with a 5 ms average response time. This is a traditional tier 1 storage array with an additional flash storage tier and software to support it. The average IO will be faster, and there will still be significant variance in the IO because of the disk drive accesses. Storage hardware and software costs will be higher, environmental costs will be slightly lower and there will be fewer higher-speed servers with additional DRAM to balance the system. Infrastructure software will be slightly lower because of the fewer servers, and operational support will be significantly lower. The overall cost of the system is higher than a traditional storage system. However, application user productivity should be greater because of the lower system response times from the balanced configuration (see next section for discussion).
- All Flash Array with DRe & a 1.5ms average response time. This array includes data reduction technology (DRe) with both compression and de-duplication. The amount of storage is reduced by a factor of 4 (see assumptions in Tables 1 & 2 below). The number of servers is lower with even more DRAM, the infrastructure software costs are slightly lower, the environmental costs are much lower and the operational support costs are lower. No tiered software cost is required. The overall cost is much lower than traditional disk-based array systems. In addition, the productivity of application users should be significantly enhanced. The assumption of the number of copies is 2, as the IO density of flash make it easier to share & update one copy of physical data from many logical copies. This number will rise over time as the operational procedures are improved (see previous Wikibon research for further discussion).
- All Flash Array without DRe & a 1 ms average response time. The cost of the flash storage is higher in this case, because of the lack of DRe, but the response time is lower. The other costs are similar to the all-flash array. The assumption of the number of copies is 1.5, as the focus of the infrastructure will be on reducing latency and reducing the amount of sharing. This number will rise over time as the operational procedures are improved.
- Low-latency Flash without DRe & a 0.3 ms average response time. The cost of the storage in this use case is much higher, but the IO latency is reduced very significantly to 300 microseconds. Other costs are adjusted slightly, but the major impact is on the significant enhancement to application user productivity. The assumption of the number of copies is 1, as the focus of the infrastructure will be on reducing latency as much as possible, with no sharing.
An alternative method could have been to reduce the cost of infrastructure and maintain the same system response time to application users. As this research is focused on the justification of improving response time on IT and application users, the basic assumption across all the configurations is to maintain the same number of users, and improve the system response time for those users.
-
Figure 1: Impact of Storage Latency on Infrastructure Costs
- Source: © Wikibon, 2015, based on Tables 1 & 2 in the Footnotes below.
Impact of Flash on IT Database Service Costs
This section looks at the impact of IO latency on database service delivery costs. Most database software is licensed by processor core, and the three year cost of licensing and maintenance is assumed to be a modest $29,500 per processor core including all discounts. When the database costs are added to the infrastructure costs in Figure 1, the database costs dominate. The benefit of reducing the number of server cores is shown dramatically in Figure 2 below.
-
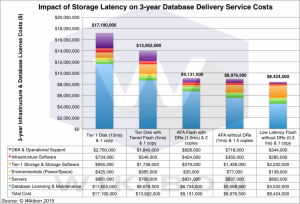
Figure 2: Impact of Storage Latency on Database Delivery Service Costs
-
Figure 2: Impact of Storage Latency on Database Delivery Service Costs
- Source: © Wikibon, 2015, based on Tables 1 & 2 in the Footnotes below.

Impact of Flash on Application User Productivity
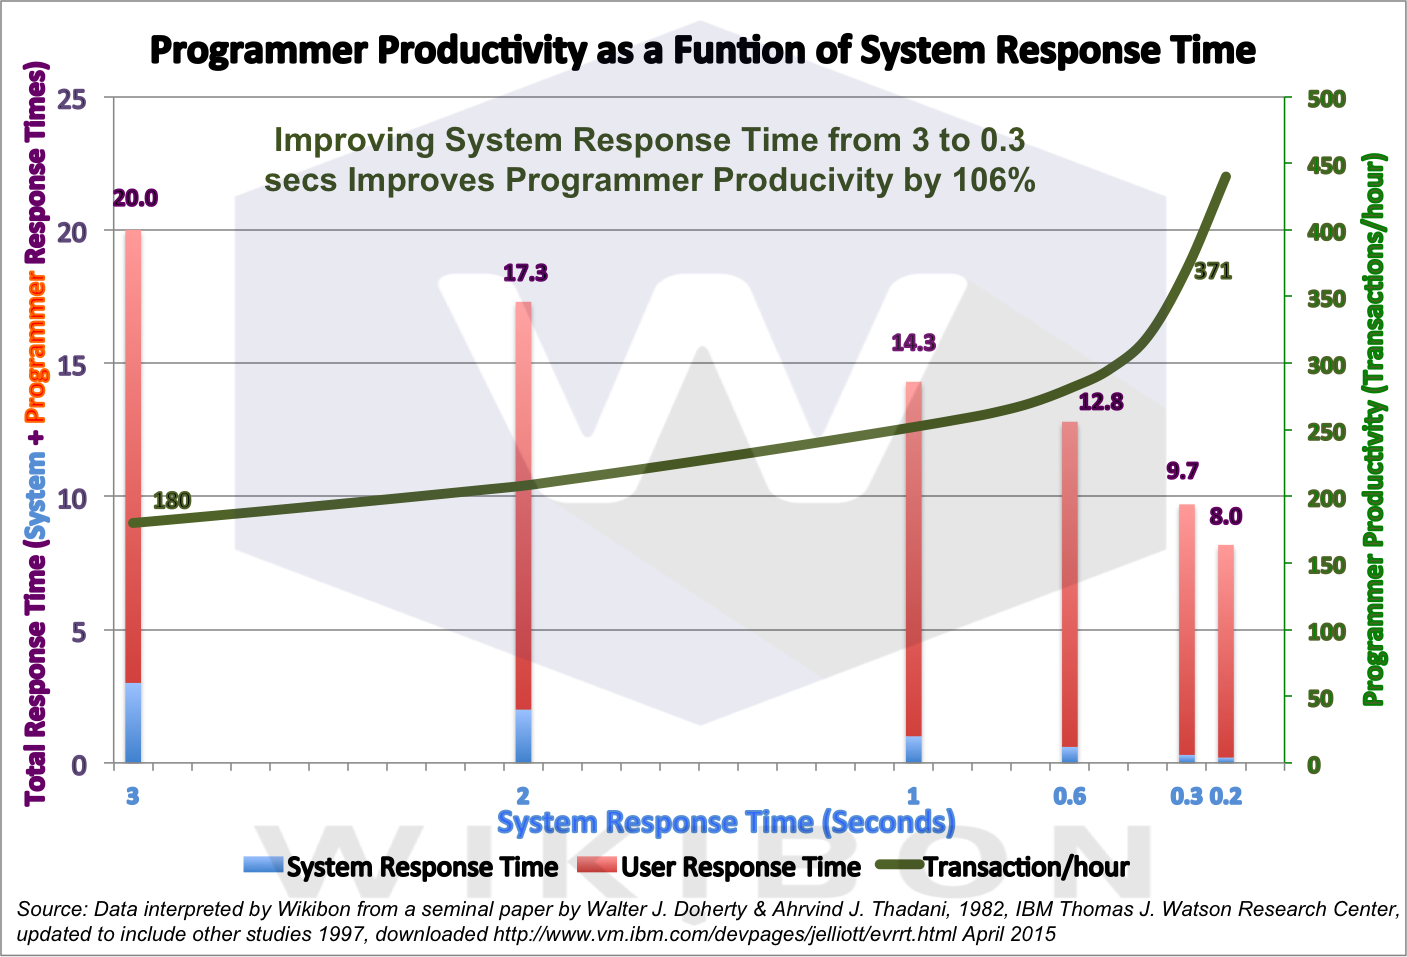
Lower and more consistent response time has been consistently found to improve end-user productivity. The seminal work on this issue was done in the IBM Thomas J. Watson laboratories years ago. Figure 3 shows the impact of reducing system response (the small blue bars varying from 3 seconds to 0.3 seconds) on user response time (pink bars). The productivity impact is shown in the green line, which improves the productivity of the user from between 28% to 106% while the user is using the application.
-
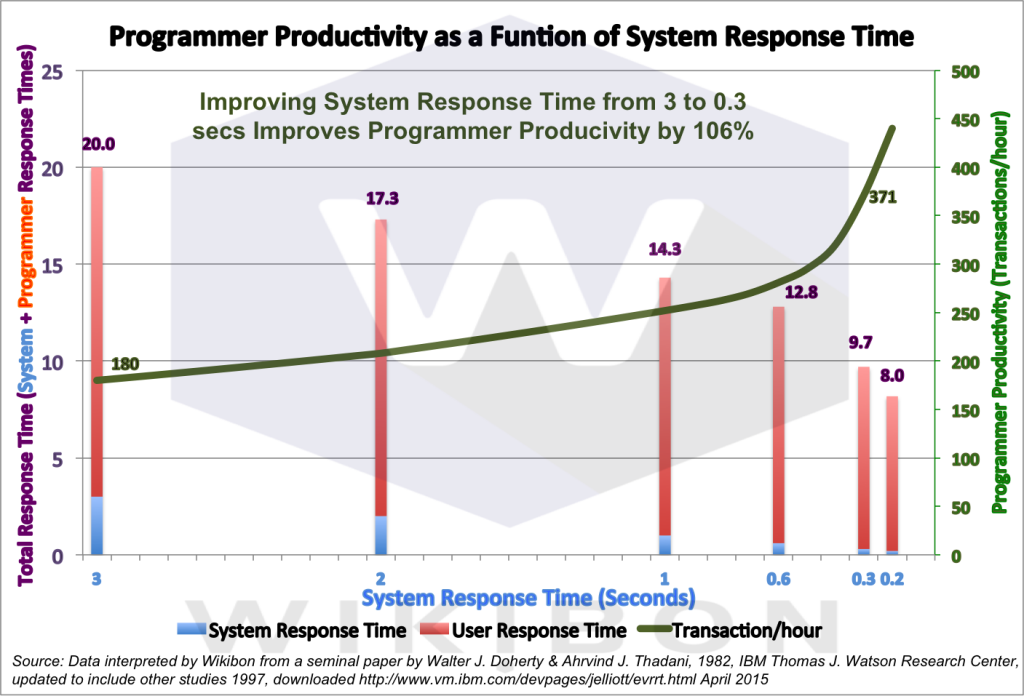
Figure 3: Economic Impact of Rapid Response Time
Source: Data extracted and charted by Wikibon from the Seminal paper by Walter J. Doherty & Ahrvind J. Thadani, 1982, IBM Thomas J. Watson Research Center
http://www.vm.ibm.com/devpages/jelliott/evrrt.html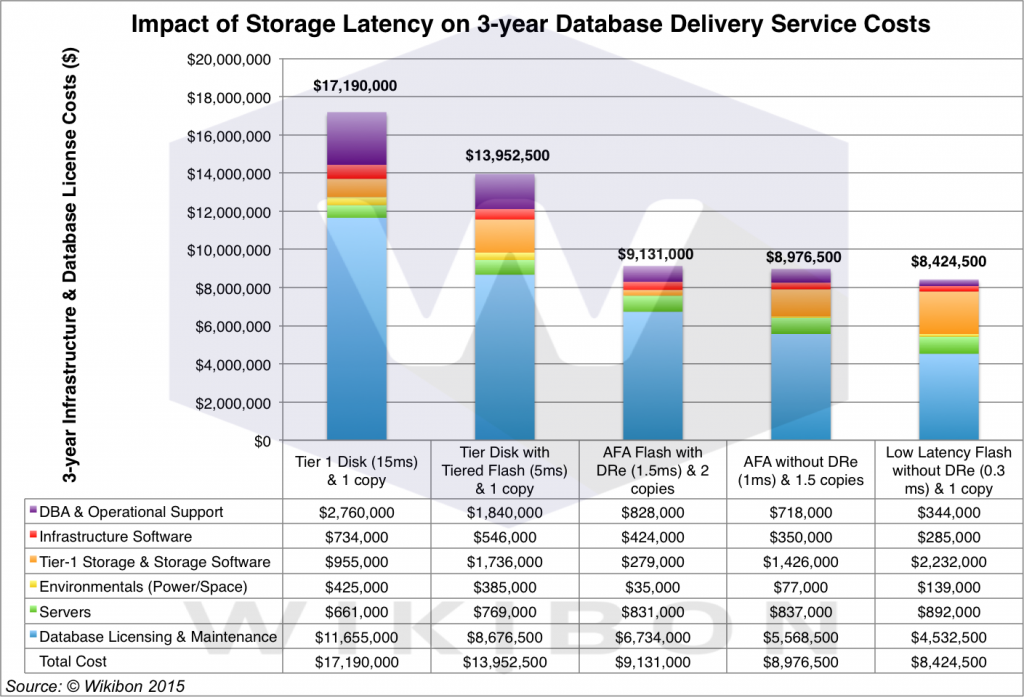
Figure 3: Economic Impact of Rapid Response Time
Source: Data extracted and charted by Wikibon from the Seminal paper by Walter J. Doherty & Ahrvind J. Thadani, 1982, IBM Thomas J. Watson Research Center
http://www.vm.ibm.com/devpages/jelliott/evrrt.html -
Figure 3: Economic Impact of Rapid Response Time
Source: Data extracted and charted by Wikibon from the Seminal paper by Walter J. Doherty & Ahrvind J. Thadani, 1982, IBM Thomas J. Watson Research Center
http://www.vm.ibm.com/devpages/jelliott/evrrt.html

A Wikibon case study on Revere showed an overall IT contribution to business productivity of 10%, as a function of increased revenue gained with a level headcount. These gains were from the introduction of very low latency storage. The system performance improvement allowed Revere to exploit their Epicor Eclypse ERP system more effectively, and allowed the users to be much more productive. This productivity improvement is estimated to have generated over one million dollars ($1 million) in business savings for Revere over three years, direct to the bottom line.
Table 3 in the footnotes shows the detailed business assumptions behind Figure 4 below. Figure 4 shows the results of applying these assumptions to Figure 2 above. The IT savings are taken from Figure 2. The conservative assumptions are that the system in Figure 2 supports a revenue of $500 million, with a staff of 2,000 costing $58,000 for their average fully burdened salary. The assumption of the amount of time application users spend on the IT system is a conservative 10%, based on extensive Wikibon research in this area.
Applying these figures to the productivity improvement shown in Figure 3 above, Figure 4 shows clearly that if the lowest latency storage possible is applied to this environment that savings of over $26 million can be realized.
The assumptions made include the fact that the response time was mainly gated by IO response time, and this is true for most systems. Clearly some systems may be gated by other factors, including processor performance and network performance. Effort should be applied to reduce all the system constraints to optimize the value of the system to the business.

-
Figure 4: Economic Impact of Rapid Response Time
Source: Data extracted and charted by Wikibon from the Seminal paper by Walter J. Doherty & Ahrvind J. Thadani, 1982, IBM Thomas J. Watson Research Center
http://www.vm.ibm.com/devpages/jelliott/evrrt.html
Action Item
Wikibon strongly recommends that enterprises adopt an electronic data center strategy to move to an all flash storage environment (see Wikibon research on the future projections of storage costs). The starting point should be key business database systems, with an emphasis on providing the lowest storage latency. Other systems can be migrated over time as the operational ability to share physical data increases.
David Floyer, CTO Wikibon
david.floyer@wikibon.org
Footnotes:
The assumptions behind the Figures 1 & 2 above are given in Tables 1 & 2 below. Figure 4 is supported by the assumptions and calculations in Table 3 below.
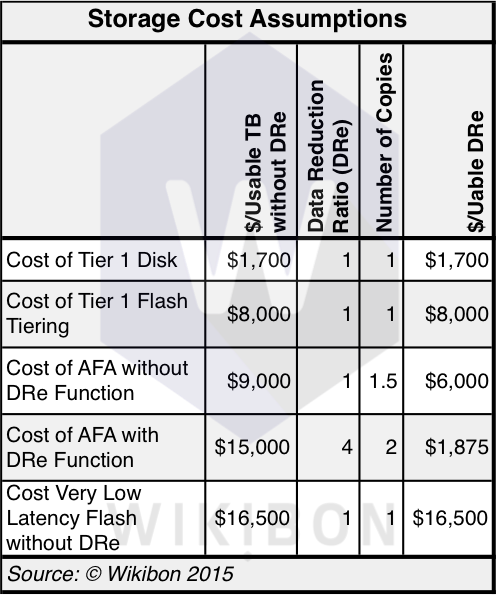
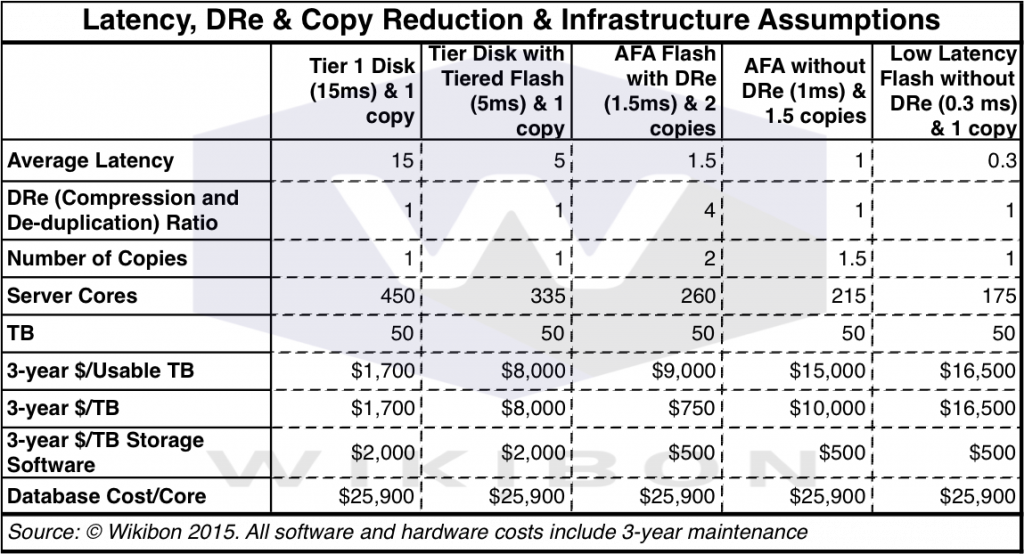
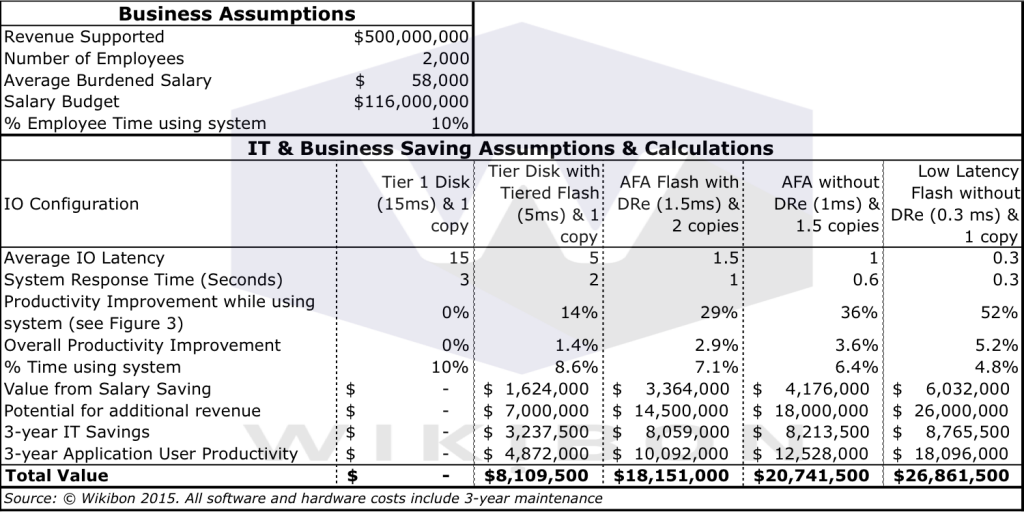
Table 3: Business Case Assumptions
Source: © Wikibon, 2015