Executive Summary
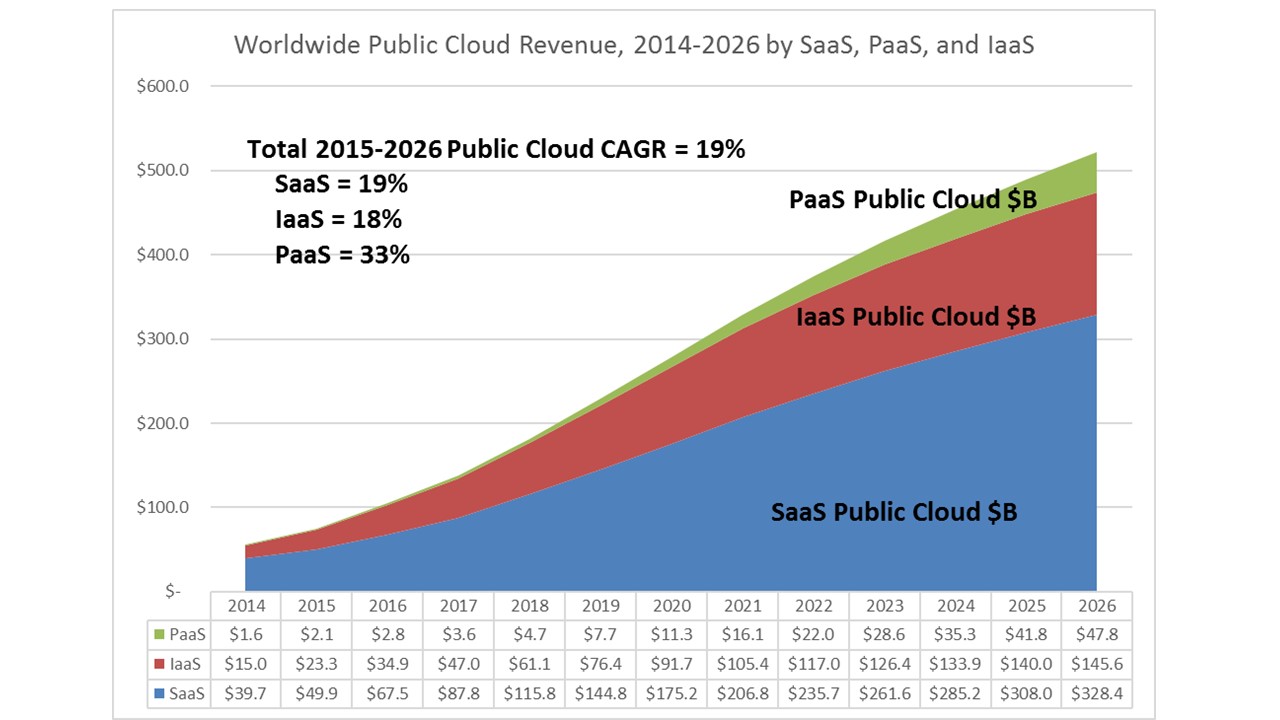
In this report Wikibon updates its August 2015 public cloud forecast. Based on market conditions that we have observed over the past year and the recent public cloud earnings results of Amazon, Microsoft, Oracle, SAP, and IBM, we expect that public cloud spending will continue to accelerate rapidly, growing from $75B in 2015 to $522B by 2026 (19% CAGR). Figure 1 shows that each public cloud segment will have rapid growth rates: SaaS (19% CAGR), PaaS (33% CAGR), and IaaS (18% CAGR) during this period. How big will public cloud be? By 2026, cloud will account for nearly 50% of spending related to enterprise hardware, software, and outsourcing services. Why? Because:
- Enterprise adoption of public cloud is faster than expected. Our forecast of a year ago was “cautiously optimistic” pending another year of visibility into vendor strategies and customer adoption rates. This year’s forecast is upgraded to “optimistic”, so we’re increasing our forecast in the out years – rising by and additional $24B in 2026.
- Older and new software is “going cloud.” One of the reasons we’re more optimistic is that almost all new software start-ups and most big software vendors are driving hard at the public cloud.
- Cloud is the choice for new non-tech vendor offerings. Most non-tech vendors that are extending their products with digital offerings (e.g., GE Predix for IoT) are cloud-first.
Public Cloud Trends and Dynamics Point to Strong Growth
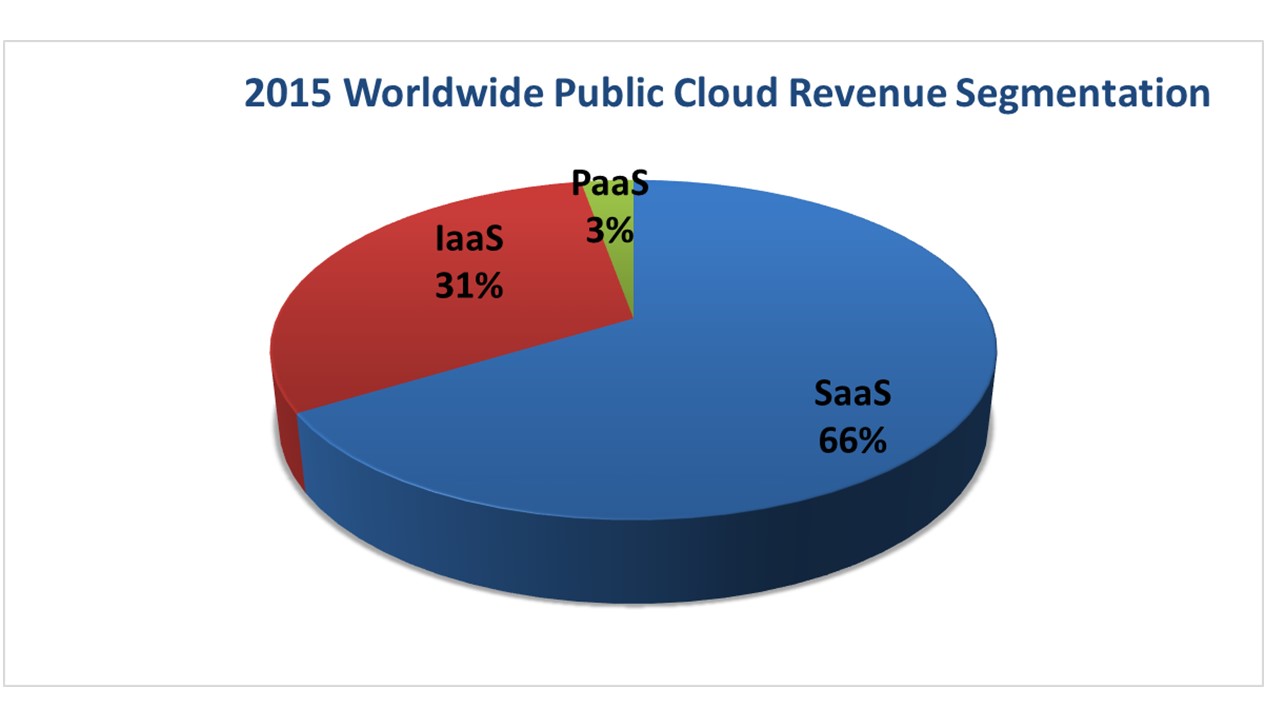
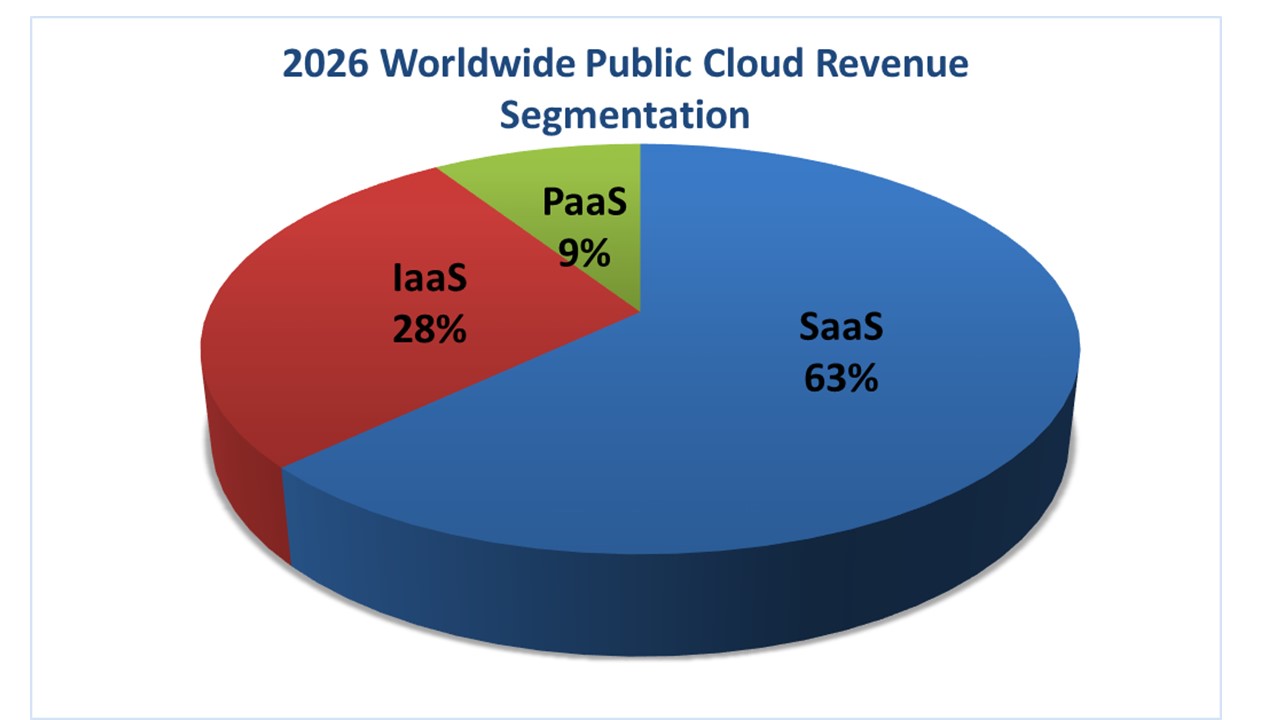
Public cloud revenue will grow by 19% compounded annually, to $522B by 2026 from $75.3B in 2015 (see Figure 1) . Each Public Cloud segment (see Figure 2 and Figure 3) will grow by double digits in this period – PaaS (33% CAGR), SaaS (19%), and IaaS (18%).
Key Drivers and Inhibitors – Drivers are Winning
Wikibon is seeing higher rates of enterprise adoption of public cloud offerings in 2016 than we saw in 2015, indicating that the market has transitioned to “early majority” stage of adoption. At this stage, enterprises are more deliberate buyers, demonstrating clearer preference, evaluation, and procurement patterns. While factors like “pay as you go” remain high on the list of enterprise values, increasingly they seek the superset of cloud promises — greater plasticity in the business and technology infrastructure, in addition to financial flexibility. Importantly, concerns about cloud security and responsiveness to compliance regimes are abating. We are approaching the day when mainstream enterprise users think “Using AWS or Salesforce.com will never get me fired.” Why? Because:
- Traditional software vendors are aggressively transitioning to subscription and cloud models. Software providers are adjusting business models to accommodate subscription revenue streams. The biggest players, like SAP, are using a move to the cloud to bring modern application architectures to their customers, incorporating mobile and IoT features, as well as streamlining maintenance and support models. Additionally, they’re bringing their partners with them, making the core functions of their software available using APIs, thus beginning the process of moving from an applications to a platform approach to competing. This will amplify the speed of the transition to public cloud: As big players go, they bring supporting partners with them..
- Mobile is the default method for interaction with customers. Modern application architectures are “mobile first” because businesses cannot bind employees or customers to specific locations or times anymore. Cloud provides the simplest approach to ensuring high-value business services can be made available to whoever — or, in the case of IoT, whatever needs them — wherever and whenever they might be required.
- Big data and IOT emerge as growth engines. While big data and the internet of things (IoT) comprise a tiny fraction of public cloud workloads today, both are growing rapidly and public cloud is part of the solution mix. By 2020, these two domains will feature large in the growth and dynamics of the public cloud market. Much of the growth will be in IaaS and PaaS, but we also expect to see higher availability of SaaS applications in these segments in this period
- Emerging market adoption is accelerating. In its early stages, the public cloud market has been driven by North American providers and buyers. Over the forecast period we expect to see accelerated growth coming out of the emerging markets, especially in Asia where small and medium businesses (with a natural public cloud affinity) represent a larger proportion of the overall enterprise business environment than is the case today.
- Investment levels in public cloud are high and getting higher. Cloud-oriented venture capital firm investment and capital spending by vendors — especially the large public cloud suppliers — has been strong, and there is still a lot of work to be done. No vendor can be sitting on their hands in this environment.
These are the leading contributors to aggregate growth of the public cloud market. However, the specific shape that the market takes as it starts to mature is coming into view, but still remains subject to multiple factors. As the public cloud opportunity accelerates, these considerations will start to exert real pressure on the long-term structure of the market, including:
- What will HP, IBM, Oracle, and Dell customers do? Our research shows that public cloud is capturing new and complementary workloads, but wholesale substitution of existing data centers by public cloud remains the exception. While some small and medium enterprises have successfully made a full move to cloud, and many more are in an exploration or planning process, infrastructure transformation continues to take place on-prem and in the public cloud, together. HP, IBM, Oracle, and Dell Tech have the most to lose as AWS, Salesforce.com, Google, and smaller companies like ServiceNow position to take more workloads from installed systems. Moreover, hundreds of smaller regional players, each appealing to local or specialized customer bases, are vying for enterprise and local business as rules for data ownership and processing evolve. IBM, Oracle, and HP all have strongly indicated that they will aggressively compete for the cloud-based future of their installed bases, but each starts with different situations, strengths, and levels of commitment. How these three play their public cloud cards will impact as much as a third of public cloud spending over the next decade.
- Are private cloud alternatives up for the challenge? Growth in the public cloud market is not crowding out investment in private and hybrid cloud alternatives. Cloud growth is strong, period. However, Wikibon enterprise clients indicate that they continue to struggle to adopt private cloud alternatives because they have a hard time keeping up with the pace of market change being driven by public cloud suppliers. The goal is True Private Cloud: implementations of private, converged, cloud-related technologies in the data center that behave and cost like public cloud options. True Private Cloud, however, is proving difficult to realize because of the difficulty of finding talent and establishing sourcing arrangements at scale. Perhaps hybrid cloud is a necessary pre-condition to eventual deployment of workloads in the public cloud, but increasingly we see enterprises jumping directly to public cloud alternatives for at least some workloads.
- Is the market ready for a cloud-based industry structure by 2026? The stakes for an enterprise to get its public cloud strategy right are very high. Wikibon believes that public cloud will represent as much as 46% of replaceable IT revenue for data center infrastructure and related services, software, and infrastructure outsourcing by 2026. Wikibon believes that as much as 61% of enterprise application software revenue and 32% of infrastructure revenue will be in the public cloud by 2026. Most enterprises are not remotely prepared for a world in which nearly half of their third-party spending goes to companies operating in the public cloud.
- What will happen to services companies? Wikibon has had dozens of conversations with senior executives within leading professional services, integrators, strategy consultants, etc., many of them on theCUBE. All recognize that the traditional model is under severe pressure. Most have a strong story to tell, but it revolves around fixed fee pricing, Agile project management, streamlined integration, speed to value, and precision scoping — not your typical IT services company story.
- What will happen to Platform-as-a-Service (PaaS)? The developer community is flocking to cloud as a way to build and deploy modern applications, whatever the eventual target environment. Vendors in all three “aaS” sectors are seeking to capture developer loyalty. SaaS players, notably including SAP, are providing APIs, tool integration, and stronger partnership to capture PaaS opportunities inside their SaaS business. IaaS players, like Amazon, continue to enhance their offerings that make collaborative development and testing easier. And, of course, PaaS players, like Pivotal and Docker, are attracting huge interest as they introduce innovative approaches to improving developer experience and productivity. The evolution of PaaS remains one of the open questions in public cloud, and the answers will have a profound impact on the market’s future.
Software-as-a-Service Market
Application software is the primary force behind IT business value — and the application software focus is moving to cloud delivery. Wikibon believes that the vast majority of today’s on-premise enterprise applications will be packaged as a SaaS alternative by the end of the forecast period. This will be crucial driver of SaaS growth, which we expect will grow from nearly $50B in 2015 to $328B by 2026 (19% CAGR). In our forecast, SaaS will account for as much as 61% of application software in 2026 (up from 20% in 2015, with the bulk of the revenue coming from three segments:
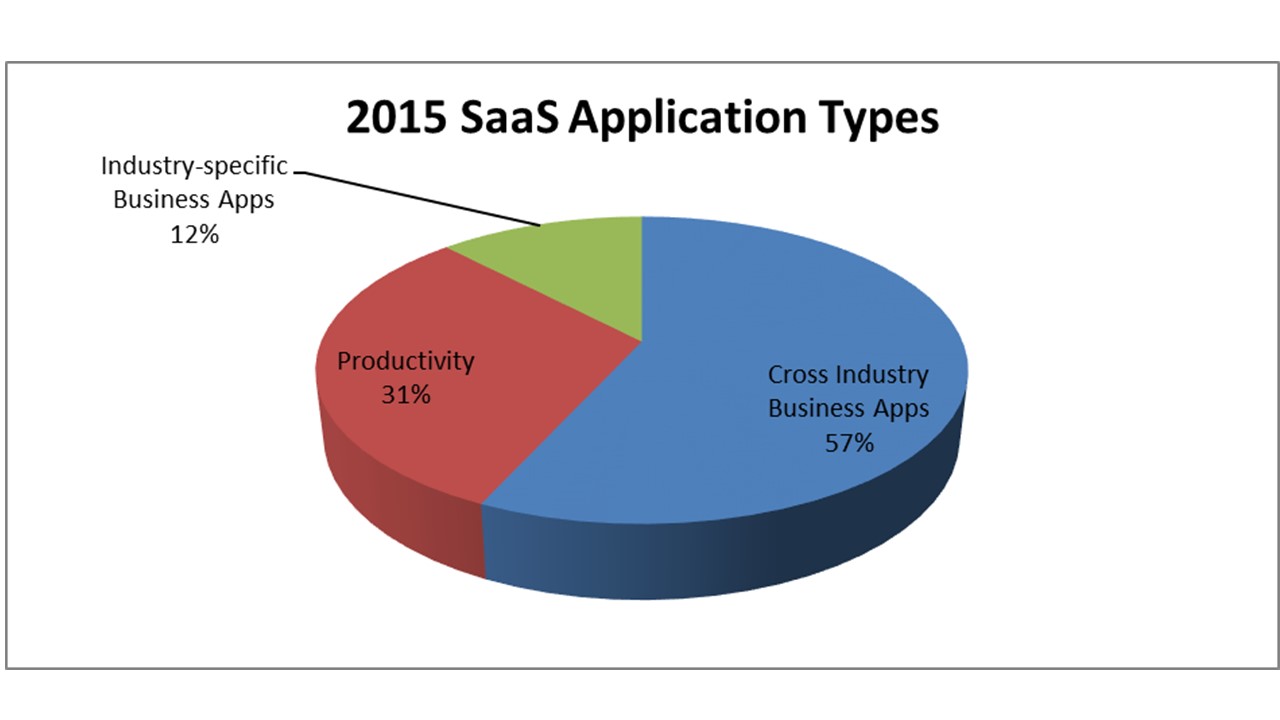
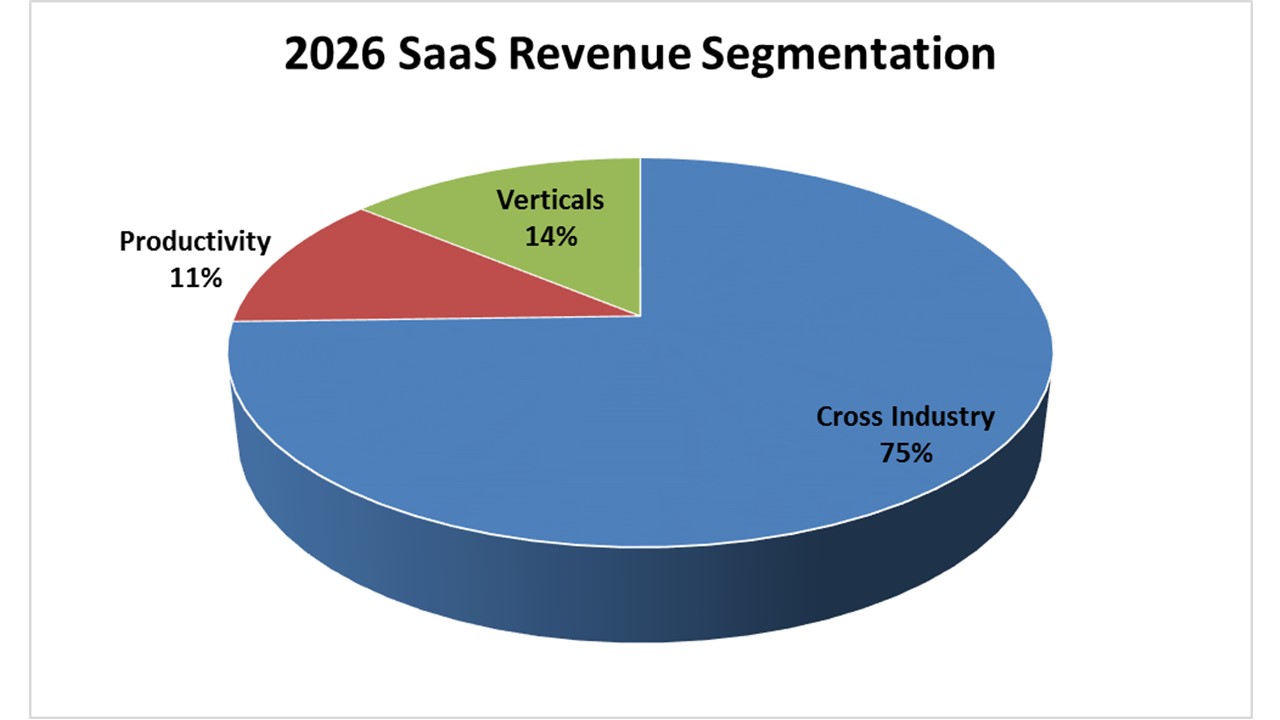
- Cross-industry applications: biggest opportunity, strongest growth. Customer relationship management, sales, marketing, human capital management, supply chain, service management, and financial software applications will account for 58% of SaaS spending in 2016 and will garner 75% in 2026. These are the applications that generate the most enterprise users, and revenue and profit tends to follow users in the software industry. As more application providers, large and small, package their offerings as SaaS, competition will heat up in the cross-industry app market for three reasons . First, the move to SaaS will catalyze a loyalty decision; generally, enterprises won’t swap apps as they move to cloud, but some will. Second, established software companies will use their SaaS-based APIs to steal partners from each other. Third, and most importantly, many cross-industry apps will become the new “infrastructure” in the SaaS market; the new developer targets for modern, integrated business applications.
- Productivity applications fast out of the gate, slowing earlier. The overall market for productivity applications is quite mature, growing slightly faster than the IT spending overall. However, the productivity software market is moving to cloud packaging faster than other software markets because cloud simplifies document lifecycles, and productivity software file and document formats generally are easier to migrate to new platforms than more complex database-based applications. Additionally, cloud-based firms like Google are attacking these segments with price — for example, Google docs is mostly free — which is forcing the leading providers of these applications, notably Microsoft, to evolve their pricing models. For these and other reasons, we expect cloud options to continue rapid penetration of the productivity apps space but reach their asymptote well before the end of the forecast . Pricing and penetration will mean that while these apps accounted for 31% of SaaS spending in 2015, they will only represent 11% of all SaaS spending by 2026.
- Industry-specific industry SaaS offerings. Healthcare, manufacturing, insurance, transportation, and hospitality will be among the leading targets for industry-specific SaaS applications. Our market model shows that industry-specific apps will account for 10% of public cloud SaaS revenue in 2016 and will grow to 14% by 2026. Industry-specific SaaS applications will grow from 6% of all industry-specific software revenue in 2016 to 30% by 2026. The Industry-specific segment will always have a high degree of fragmentation and specialization as well as data movement concerns (especially at the edge) that will make public cloud adoption slower going. While Cross-industry and Productivity applications will continue to be the leading segments of SaaS in the near term, we expect IOT and in-line analytics for business operations in the public cloud, including vertical solutions, to become more important in the 2020s.
Infrastructure-as-a-Service Market
The public cloud IaaS market will grow from $23.3B in 2015 to $146B by 2026 (18% CAGR). Like the infrastructure hardware, software, and services markets today, the public cloud IaaS market will be much less fragmented than the SaaS market. AWS, Microsoft Azure, IBM Cloud, and Google are the leaders today, but we expect regional and workload-specific vendors to begin to emerge in the coming years.
Key drivers for IaaS growth include:
- New initiatives starting in the cloud. AWS, Microsoft, and IBM continue to report stratospheric public cloud revenue growth numbers; albeit from different segments of the IaaS market. AWS is the go-to provider of cloud for disruptive start-ups and — in growing numbers — mature enterprises looking to shake up their markets (see http://wikibon.com/what-do-awss-customer-stories-tell-us-about-awss-business/). Microsoft is drawing from its huge installed base of partners and small to large enterprise data centers. IBM has a huge installed base of large enterprise users in data centers as well as those using its outsourcing services. IaaS is very strong across the board of most user types and that will continue to fuel growth.
- Private cloud alternatives still lag. Private cloud is proving harder than expected. Public cloud technologies are moving at lightening speed, driven by competition among some of the most successful companies in any market, like Amazon, Microsoft, and Google. The typical enterprise just isn’t equipped to keep pace with these companies, which means that, complexity aside, their private cloud facilities will always seem inferior to public cloud options.
- On-demand infrastructure purchasing. Infrastructure purchasing patterns — whether it’s hardware or software products or outsourcing services — are gravitating towards smaller, shorter-term buys that resemble IaaS service purchasing. User expectations of the infrastructure purchase transaction is becoming more cloud-like – and less advantageous to traditional infrastructure companies trying to sell longer term commitments to their proprietary offerings and roadmaps.
Platform-as-a-Service Market: Nascent Market Has Significant Upside
The public cloud PaaS market will grow from $2.1B in 2015 to nearly $48B by 2026, 33% compounded annually. This market overall is still in its early formative stage, both in its public and private cloud manifestations. So its robust public cloud growth rate is a function, in part, of the overall adoption of this approach to development.
The drivers for PaaS include:
- PaaS makes the development cycle much more efficient. By employing microservices, PaaS enables enterprises to realize business value much more rapidly: changes can be made more quickly and testing can be simplified. The trade-off to efficiency and rapid deployment, of course, is that for specialized requirements, this sort of generalized solution may not be appropriate. For instance, for some applications, maximizing absolute response time speed may outweigh the value of efficient delivery. But for most workloads, faster time to value and ease of execution will have the highest value.
- Public cloud PaaS will grow fast because of greenfield opportunities. Public cloud PaaS is most often deployed for new applications and start-up situations. As such there is no legacy code to migrate or emulate. PaaS in the traditional data center will have tougher road to travel — since today’s operational workloads (and developer skills) have not often been built in a manner that is conducive to PaaS tools and practices — and rip and replace is not an appealing option.
- Considerable VC investment into this space bolsters growth. Docker, Pivotal, Mesosphere, Rancher, Hashicorp, CoreOS, Apprenda, Apcera — all are examples of well-funded start-ups having an important impact in developer communities. Which way developers go will have a major impact on all aspects of public cloud, but an especially important impact on PaaS. Today, developers are getting their cloud development done by adding tools to IaaS, as well as using PaaS options. Increasingly, IaaS players are offering PaaS-like services to developers. For the purposes of this forecast, we are counting IaaS revenue under the control of PaaS as PaaS.
Action Item
Enterprise actors – both business and IT – need to be actively engaging in leveraging the public cloud today and planning a strategy for a technology that could make up as much as 46% of their hardware, software, deploy and support, and outsourcing third party spending budget by 2026. At the same time, enterprises should be wary of over-commitment to any one public cloud vendor. Rather they should establish an adaptive strategy that exploits the best of today’s public cloud offerings while hedging their bets to leave open the space to move to alternative platforms as their needs and the market itself continues to develop.
Appendix A: What We’re Counting
Wikibon counts public cloud revenue in the following manner:
- Public cloud only – Professional services, advertising-related, and other spending is excluded from this report. Advertising revenue may indeed become a factor in public cloud spending in the future, and Wikibon will consider including advertising revenue if and when it becomes a factor in how public cloud services are paid for.
- Enterprise vs. consumer spending – The overwhelming proportion of public cloud spending today is by enterprises. Wikibon expects that consumer-related cloud services – i.e., productivity, collaboration, content management, marketing-related from vendors like Facebook and Twitter – will need to be enterprise standard, and will be included in public cloud in the future. Wikibon will monitor this trend closely.
- Public cloud revenue reports caveat – Wikibon acknowledges that provider reporting of “public cloud” revenue seems to be in the eye of the beholder. Salesforce and AWS are pretty much pure public cloud plays, as are many start-up software vendors all of whom report public cloud revenue fairly clearly. However, the definition of “public cloud” becomes a bit murkier for non-pure-plays.
- Microsoft (Azure, Dynamics Online, O365 Commercial, O365 Consumer) and what % of each is actually public cloud resident.
- Oracle’s SaaS (organic growth vs. acquisition?) vs. PaaS (given Wikibon’s definition) vs. IaaS are challenging to unravel
- SAP’s Cloud designation – and organic vs. acquisition growth
- IBM’s very broad array of public and private cloud services span hardware, software, professional services, outsourcing services, analytics, etc.
However, in our view, this just indicates that public cloud is being leveraged from many different angles and is building significant momentum as it encompasses both product and service delivery mechanisms, pretty much penetrating into all aspects of information technology.
Appendix B: Public Cloud Sizing and Forecast Methodology
This forecast is based on a variety of interlocking inputs and points of calibration and can be updated quarterly to reflect changing market conditions, Wikibon has drawn on a wide variety of sources to establish this public cloud sizing, segmentation, and forecast.
- Worldwide cloud spending sizing and forecast – Our growth and penetration rates for cloud for each segment are built up from reported revenue of ~100 lines of business for cloud providers. In some cases, Wikibon analysts have applied intelligent estimates where the vendor is important and the published data is ambiguous. This approach has been made easier over the past year as many more of the largest vendors are reporting cloud revenue.
- Sizing cloud segment revenue – Wikibon has conducted surveys of cloud users to gauge the applications and use cases. We have applied this data to our working revenue models to calibrate the segments where spending is strong today and where users are intending to expand their cloud use cases and spending in the future.
- Wikibon expert analysis – Most importantly, Wikibon has drawn on its expert analysts to calibrate the near term data and to create a vision of where the cloud market is heading based on their knowledge of users, vendors, and the technology evolution that will continue to press cloud into more and more varied usage scenarios.
- Underlying worldwide IT spending forecast – Lastly, our growth and penetration rates are calibrated against a WW IT Spending market model that is based on publicly reported quarterly financial data and a protocol of statistical trend analyses to estimate the likeliest revenue outcomes for the forecast period for each of ~ 150 vendors and reported business units (in the aggregate covering 45% of all WW IT spending). The approach assumes that — in the aggregate — leading vendor financial reports provide good guidance for the market’s overall growth rate. The data is weighted and aggregated for each IT industry segment within which cloud spending occurs so as to ensure our growth rates make sense in terms of rates and degree of penetration vs. available spending.
Appendix C: Special Consideration: Platform-as-a-Service Market
Wikibon’s definition of PaaS (see http://wikibon.com/2016-wikibon-public-cloud-definitions/) requires that to qualify as PaaS revenue, the usage must encompass a full application life-cycle cloud service, including initial development, testing, deployment, operations, and maintenance to suit modern continuous integration and delivery development models. As such, over time PaaS will incorporate portions of IaaS and SaaS. In our definition, individual components of development, per se, which are not used in a total life cycle platform are not counted here, but rather they are counted in the IaaS segment.
PaaS includes three classes of providers – all with different perspectives and market entry points.
- PaaS from an IaaS provider. – Amazon Elastic Beanstalk, components of Microsoft Azure, components of Google App Engine are examples here. This approach offers excellent integration with the underlying IaaS platform, rapid migration from test to production, and good vendor support. On the other hand it enables platform lock-in, has limited extensibility, may not support hybrid clouds, and skills may not be very portable.
- PaaS from a SaaS provider. – Salesforce.com Sales Force1, ServiceNow Service Automation Platform, SAP HANA Cloud Platform are examples of these. This approach (of course) offers excellent integration with the underlying SaaS platform, a rich set of platform-specific tools, rapid deployment, and good vendor support. However, performance can be problematic, and these tools may not be appropriate for general purpose use. Platform lock-in may be a risk and the skills required for the environment may not be portable to other PaaS approaches.
- PaaS from a development environment provider. – IBM’s Bluemix, HP’s Helion Development Platform, Pivotal Software’s Cloud Foundry are examples of these. This approach supports a DevOp IT structure and is characterized by flexibility to deploy easily on a supported infrastructure platform and supports a wide range of languages and management tools. There is less risk of platform lock-in and the approach does encourage good skills portability. This approach may be a good one for hybrid clouds.
Appendix D: Wikibon Public Cloud Forecast Philosophy
A famous economist once said, “If you don’t forecast well, then you should forecast often.” Given the turbulence that cloud is creating in the IT Market today, the Wikibon methodology takes this advice seriously. Wikibon tracks public cloud revenue trends on a quarterly basis with the goal to provide a formal semiannual report update. This approach enables our forecasts to incorporate up-to-the-minute, auditable data to maintain running forecasts that can be recalibrated to reflect new information and real market trends.