Full stack observability is the new buzz phrase. As businesses go digital, customer experience becomes ever more important. Why? Because fickle consumers can switch brands in the blink of an eye – or the click of a mouse. Every vendor wants a piece of the action in this market including companies that have provided traditional monitoring, log analytics, application performance management, and related services. These companies are joined by a slew of new entrants claiming end-to-end visibility across the so-called “modern tech stack.” Recent survey research however confirms our thesis that no one company has it all. New entrants have a vision and are not encumbered by legacy technical debt. However their offerings are immature. Established players with deep feature sets in one segment are pivoting through M&A and organic development to fill gaps. Meanwhile, cloud players are gaining traction and participating through a combination of native tooling combined with strong ecosystems to address this opportunity.
In this Breaking Analysis we dive into a recent ETR drill down study on full stack observability. And to do so we once again welcome in our colleague Erik Bradley, Chief Engagement Strategist at ETR.
What is Full Stack Observability?
Before we get to the survey data, let’s frame up and define full stack observability.
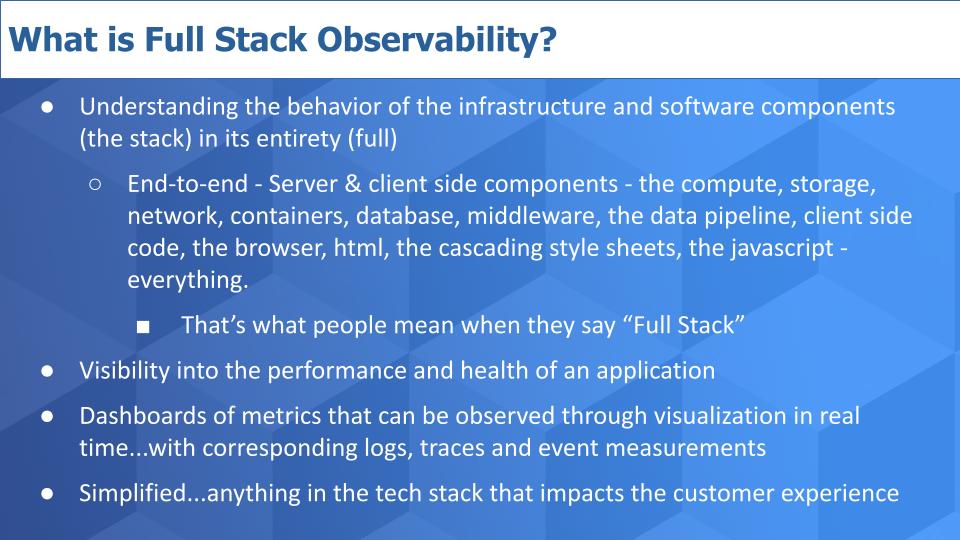
When people talk about full stack observability, they’re referring to the need to understand the behavior of all the technology components that support an application, throughout the entire system. We’re talking about the compute, storage, networking, containers, the database and other middleware components, the pipeline of data; and the client side code…the html, the CSS, everything down to the mobile device.
The idea is to give people who can fix problems full visibility into the system with a dashboard of metrics that can be visualized at a high level and then drilled into to see logs and traces and events and all the metrics that could help remediate customer experience issues.
A simple way to think about this is the ability to see everything in the tech stack that could impact the customer experience.
As Erik Bradley points out in this clip, summarized below – unfortunately, it’s not a simple problem to solve.
If only it were that simple, right? It’s a huge area we’re trying to encompass there with full stack observability. And even though the vendors might tell you on the first sales call that they can do it, it’s really not that simple. In this particular survey we tried our best to look at it. We had to survey on the application side, infrastructure side, database side, log management, security, network. It’s a very difficult thing to encompass. The holy grail would be able to do it with one vendor and do it with one dashboard. I don’t think we’re there anytime soon.
What are ETR Drill Downs?
ETR drill downs are a custom type of survey work. Drill downs can be customized in two different ways. Either ETR clients will request a particular topic and ETR will ensure they get the responses that needed. Or, more typically, drill downs are driven from the ETR research department wanting to dig into trends that our larger data encompasses. ETR has done drill downs from RPA to identity access, cloud, hybrid work, etc; and observability. This particular drill down spawned from a large amount of interest, not only from the CIO and IT buyer community but also investment and technology clients. Interest in observability is high right now with lots of inbound questions and demands for more research and deeper research in this space.
In this particular drill down, ETR interviewed respondents who have a deep understanding of observability and related topics. There were 88 respondents in this study with varying degrees of knowledge about each vendor’s offerings. Respondents were were asked to concentrate on the vendors and products they knew well.
SecOps, DevOps & Infrastructure Pros are Main Consumers of Observability Tools
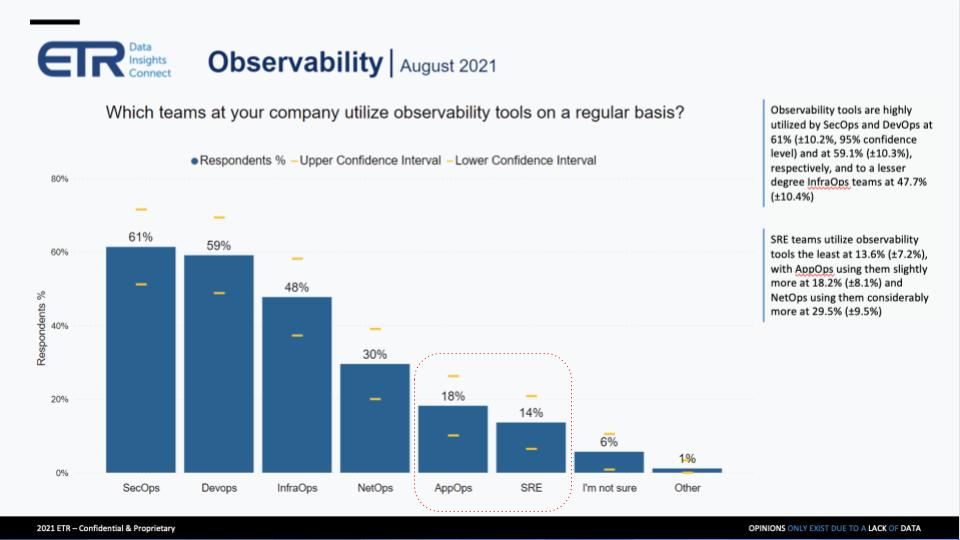
Respondents were asked – who in the organization uses observability tools. Notably, in the chart above, we’ve highlighted AppOps and SREs because given the emphasis on customer-centricity that we hear all the time from the vendor community, you would think these roles would be more highly represented. But it’s the folks in the “boiler room” that are using these tools – highly technical and specialized roles.
I was a little surprised as well. I thought the SREs would be a little bit higher on this, but it really just comes down to the infrastructure, DevOps and SecOps teams that seem to be using these tools the most. I thought maybe the application operations teams would be a little bit more involved. But I think what’s really happening here is you’re recognizing that the work is being done across the entire enterprise, as you mentioned before, across the full stack. This isn’t just one domain. It’s touching every aspect of the enterprise, and that’s including the internal IT teams.
Observability Pricing is Tricky
ETR asked on a scale of 1 to 3 (three being most preferred) which pricing model respondents most preferred. Host-based, User-based or amount of data ingested-based pricing. The results are shown below.
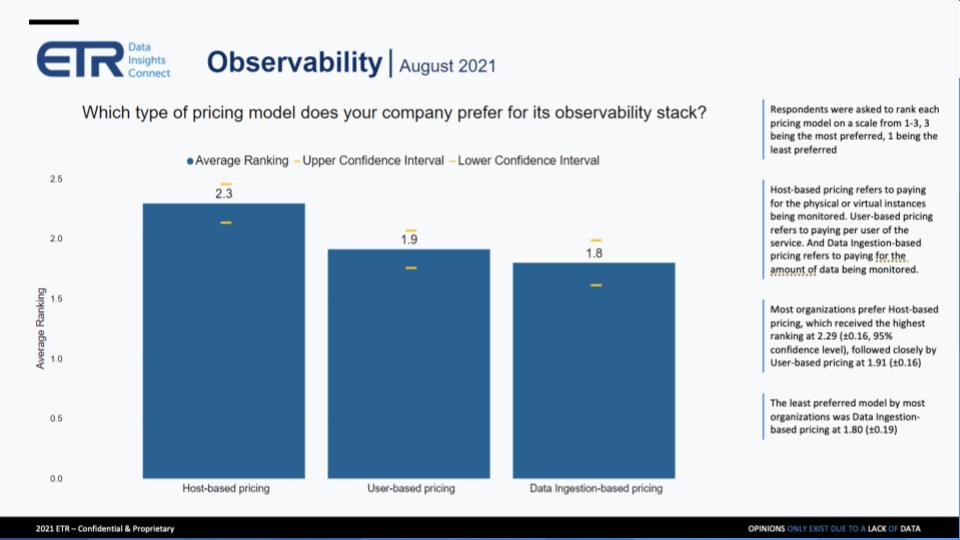
It really is all over the map from a vendor perspective, and also from an end user perspective. Of all the interviews and panels that I host – pricing’s a real concern. It is always, but in this particular space, it’s a real concern. And I actually just did a panel yesterday of four of these 88 survey takers, to get a little bit deeper. One of them said ‘ingestion pricing might be preferable, but it’s so unpredictable.’ And that’s why we’re seeing the results skew away from it. And the other one went so far and said ‘ingestion-based pricing is a nightmare that keeps him up at night.’ Because he’s so afraid he’s going to wake up the next day and see the bill. So really what they’re looking for here, and the reason the pricing is skewing that way in this survey, is because they need predictability. It’s about their budget and it’s about their planning. Even though they would prefer an ingestion based model, the fact that they have to plan for their budgets and they have to concern themselves with spending, they prefer more predictable host-based pricing models.
What Erik Bradley says can be confirmed by just taking a quick look at various pricing models. For example, Dynatrace, AppD, Datadog, AWS and others tout their host-based pricing. New Relic has a splash page advertising “No Host-based Pricing” and channels visitors to its user and usage based pricing. Datadog also touts its ingestion-based pricing for security monitoring…AWS prices by ingestion for Cloudwatch logs. Splunk prices on indexed data and calculates a per GB per day metric. So metrics, dashboards, alarms, alerts, events, etc. all may be priced differently.
Erik Bradley added this additional color:
That’s true. On the panel, one person particularly decided to call out New Relic, specifically for their flexibility around pricing. He said that they have the ability to rapidly scale up, but also contract as needed. And even though he’s a user of Splunk, he’s a user of Dynatrace, user of Elastic, he also just really wanted to call out the flexibility of New Relic in this area. So to your point, there’s a lot of different ways to price this. It’s a complex problem, but I think the takeaway for vendors is users want flexibility.
Feature Adoption – APM, Database Monitoring, Digital Experience
Now we’ll drill into the various functions and modules to assess adoption. This chart below shows adoption for application performance monitoring (APM), database monitoring and digital experience down to the user.
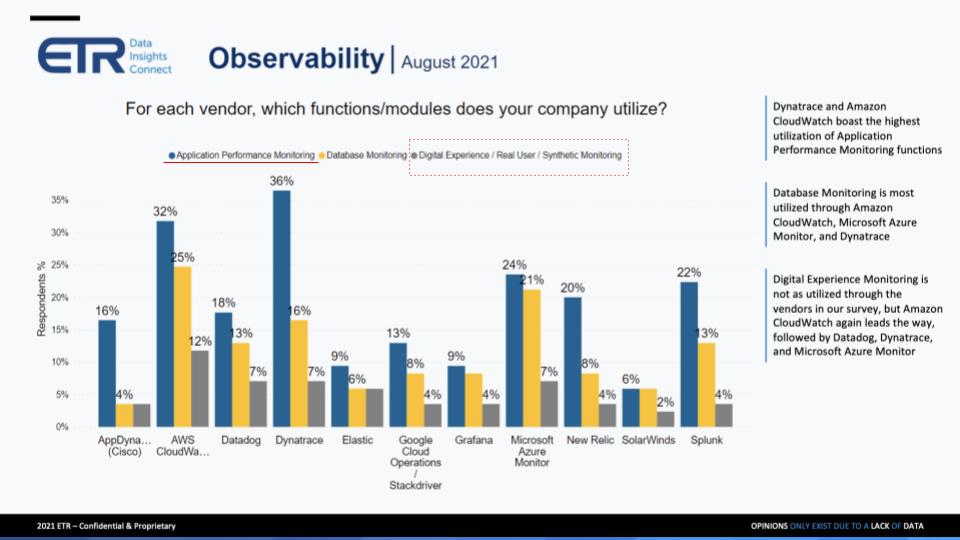
We underlined APM, the blue bar, because it seems to stand out, especially for AWS and Dynatrace but also Azure, New Relic and Splunk. And we highlighted Digital Experience, the gray bar, because despite all the chatter in the market about digital transformation and customer experience – other than a slightly higher response percentage for AWS – not a lot of adoption on that front. So the vendor marketing doesn’t match the user behavior.
Erik Bradley provides his additional commentary.
There are a couple of things to point out here, but let’s stick with digital experience. I was surprised that it was so low on this slide and overall in our survey. I did expect it to be more. And not just from the vendor marketing perspective, but you and I both know at the end of the day, the whole point of this is to actually get into that 360 view of what your customer is doing. So I was a little bit surprised to see it that low. When we spoke to the panel yesterday, a couple of people said, “No, listen, it’s not that we aren’t doing that. It’s just that it’s not the vendors that you put on this survey.” And they called out two particular names. One is called CatchPoint and the other one is ThousandEyes. And I think you’re aware of ThousandEyes, so I’m going to transition that off to you.
Catchpoint, Inc. is a thirteen year old company that focuses on end user experiences using techniques like synthetic monitoring combined with actual user monitoring data to improve customer experiences. The company offers a suite of monitoring services and is one of the many smaller names in the space.
ThousandEyes is a cloud and Internet focused monitoring platform. The company was acquired by Cisco last year, which bundles the ThousandEyes product in with Cisco’s AppD and Intersight offerings to round out its full stack observability offering.
Feature Adoption – Incident Management, Infrastructure Monitoring and Log Management
The chart below focuses on the next set of drill down questions posed by ETR to its panel.
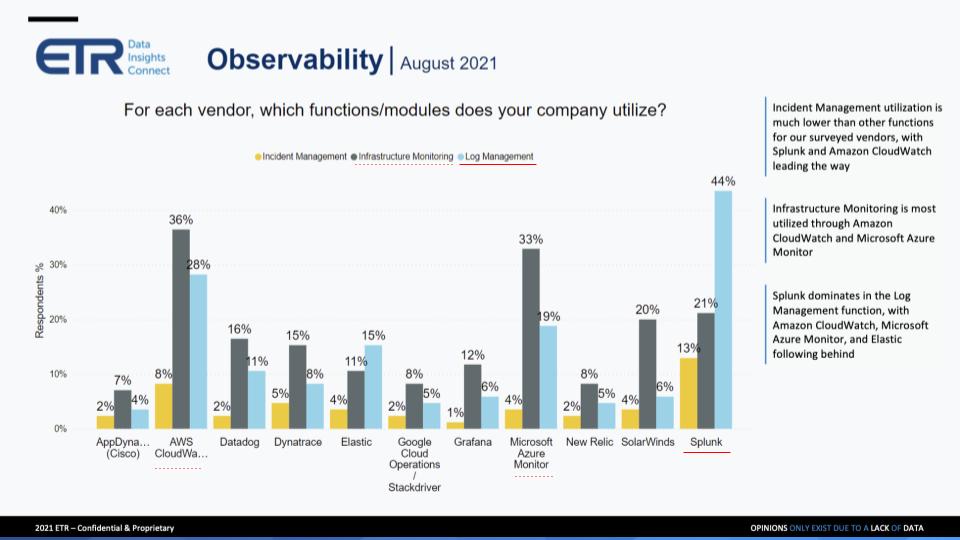
In this chart, we called out Infrastructure Monitoring, the gray bars, and Log Management, the light blue bars. AWS and Azure stand out in these categories and Splunk of course is strong in Log Management.
Erik Bradley provides his comments in this clip and below.
The previous slide and this slide, you really have to call out AWS CloudWatch and Microsoft Azure Monitor. They are very pervasive in this survey. But a couple of things I do want to point out. Even though these numbers are so high for these cloud tools, the panelists and the people I spoke to in more detail all said, “Listen, I’m going to look at my cloud tools first. I’m on their infrastructure. They’re handing it to me. And I’ll use it for what it’s good for. However, we’re in a multi-cloud world and they’re not good at things that aren’t in their ecosystem.” So even though these numbers are high, I do not believe that AWS or Azure is going to go and take over all the independents. In a multi-cloud world, they want an independent vendor, whether it’s a Datadog, New Relic, we can talk about all of those later.
But you know, really, I was surprised that the AWS particularly was so high and so pervasive in here. Splunk, what can you say? I mean, they are the most pervasive vendor, you know, they’re everywhere. We had people in the panel call them a Swiss army knife. And you know, that’s a good and a bad, that they have a lot of breadth of coverage, which is great, but because there’s a breadth of coverage, not all of it is great. Log management without doubt is what they are great at. They’re specialized at it. But the panelists were saying, “Listen, if you go away from their core and you try to use some of the other things they claim that they can do, it requires a lot of heavy lifting.”
Feature Adoption – Network Monitoring, Security Functions & Security Monitoring
Below we drill into Network Monitoring and Security Monitoring and Other security functions.
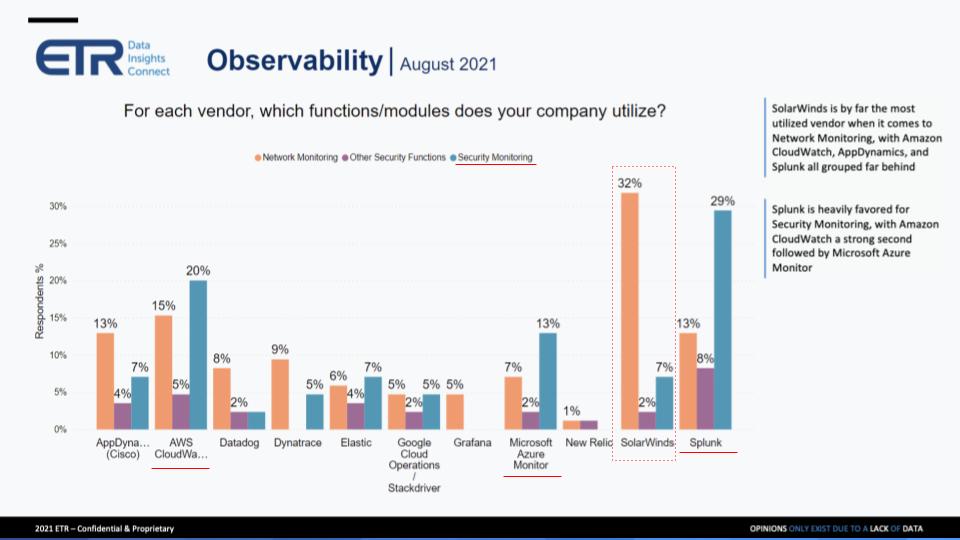
A couple of things stood out to us on the chart. Specifically, we highlighted security monitoring, the blue bar, because you see adoption from AWS, Azure and of course Splunk. And we also called out SolarWinds because of the large adoption in Network Monitoring.
Erik Bradley provides his commentary on the data.
I could go on for a while about SolarWinds. I guess, it broke around 12 months ago, even though the breach was prior to that, the headlines were big. You remember, you and I last year did a quick drill-down survey just on SolarWinds and the impact that we thought it would have. There’s a very real impact happening. With that said, they’re not easy to move away from. We asked is there any one vendor that could take this entire space? And the answer was SolarWinds was best positioned to do that, but it’s too late now. And then I drilled down a little bit and I asked the panel, “Well, what can they do to reinvent themselves? What can they do to change the reputational damage from this breach?” And the panelists all said, “Nothing.” The reputational damage is done. The best way for them to reinvent themselves would be to do M&A, consolidate with somebody else, change their name.
Users truly believe that right now, the only reason that people are still using SolarWinds is it’s not that easy to lift and shift away from. But there will be no new net workloads going to these people, at least according the ones who took our survey. That’s on SolarWinds, and we could get into more but I think that’s giving the crux of the matter.
On Splunk, again, what can you say? On the security side, on the SIEM side, people don’t want to use multiple vendors. On the other side, we were talking about with full stack, some might be better at APM, some might be better at infrastructure monitoring. When you’re talking about security, you truly do want one vendor to rule them all. And Splunk does seem to be the one that’s most well-entrenched on the security side. And as long as the policy is consistent across security, you really can’t say much about them. So what they do well, their core, the data shows that people still trust Splunk.
How Buyers Rate Strengths & Weaknesses of Each Vendor
The last set of data we want to show takes the results of several drill down questions and consolidates them into a single chart as shown below.
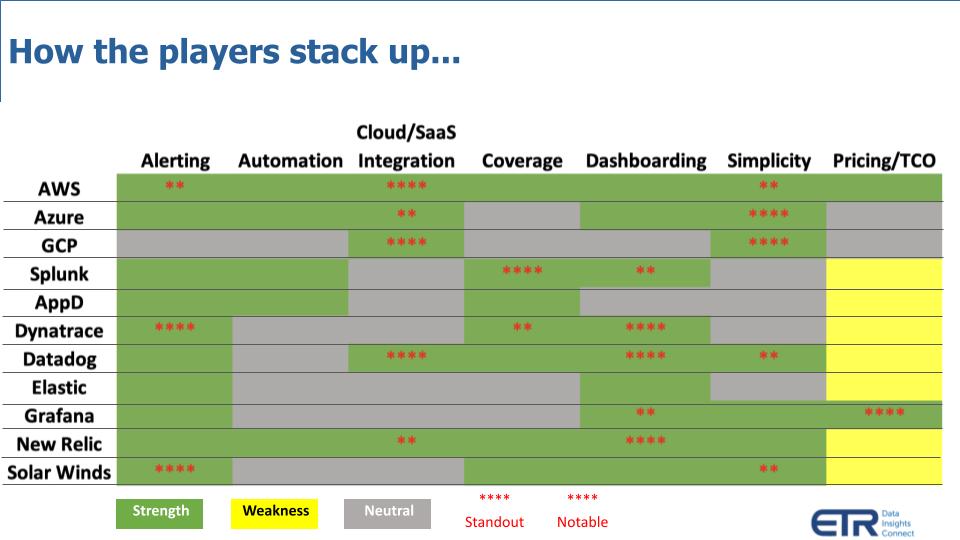
For each of the eleven companies above, ETR asked respondents if the features across the top were strengths, weaknesses or neutral. And what we’ve done is try to consolidate the chart showing the following: 1) Strengths are in green– meaning more than 40% of the respondents identified the feature as a strength; 2) The weaknesses in yellow– meaning more than 20% of respondents cited the feature as a weakness; and 3) The neutrals in gray– where neither of those conditions were met. And what we did is add four stars for standouts features, where 60% or more of the respondents cited the feature as a strength; and 2 stars where the rating was close to 60%, and weaknesses were in the single digits.
The following three key points are notable:
- The two big cloud players, AWS in particular, but also Azure, have a relatively strong showing. And we say relatively because there wasn’t a single feature category for any vendor where more than 70% of the respondents cited a strength for that feature.
- Pricing is a sore point for many of the customers, including those evaluating SolarWinds, New Relic, Elastic, Datadog, Dynatrace, AppD and Splunk. Only AWS and Grafana were not hit negatively on pricing.
- New Relic stands out as showing relative strength.
One last point on AppD (acquired by Cisco in 2017). The drill down focused only on AppD but as we mentioned earlier, companies that have mature products are filling in their gaps. Cisco, for example, has put an interface layer over AppD, Intersight & ThousandEyes. These are three separate products in the space but Cisco is going to market with a strategy that bolts them together and markets them as its observability solution. That’s not a bad strategy because combined, they can claim even more depth and breadth.
Erik Bradley provides his perspectives on the above data:
On a macro level, the obvious situation here is this is a crowded marketplace and consolidation is needed. I had one panelist say to me yesterday, “I can’t wait for this to consolidate. Like, this is just crazy. There needs to be consolidation.” Now to your point about Cisco; Cisco is taking the same playbook they did with security. They’re going out and they’re buying great tools. And then now we have to make sure that they integrate these. The security side took them a little while to do that, but they’re getting there. Hopefully, they can do this a little bit quicker here. What we did here is that AppD is actually very strong on the application monitoring side, with a core APM. Maybe not so much on these others. And then that’s why they go out and do M&A and make these moves.
Talking across the board, pricing was a problem for most of these vendors. So it just seems to me that the end users, the buyers just feel like, “Hey, I shouldn’t be paying this much.” We’ve got a lot of choices. We have to figure it out, because they do not want to pay this much. It was the number one concern across almost every single vendor.
Another aspect that I really want to call out on this, and it’s something that our research team found really interesting. And it’s about the digital transformation. As digital transformation continues, the workloads are moving towards the cloud, and we’re clearly seeing in this data that’s benefiting the newer players, the Datadogs and the New Relics, versus some of the others, like a Dynatrace and a Splunk. And when you go and actually look at the cloud SaaS integration answer option specifically, it becomes very, very obvious. Splunk had a 38% on that number, whereas Datadog had 61%, New Relic had 58%. So it’s just very clear, as digital transformation increases the need for observability, it is lifting all boats, but it’s lifting some faster than others.
Everyone Wants in on the Observability Act
As we said at the top, you have a set of incumbents jockeying for position. Companies like Datadog, with its cloud-friendly model and Elastic with open source, are both going after Splunk’s installed base. You see startups like ChaosSearch out now talking about how to do log analytics. They do more than that but it’s their starter use case – i.e. going after the Elastic and the ELK stack which got dinged a bit in the survey on simplicity. That’s not a problem if you’re comfortable with a full open source model but maybe not as well understood as some of the solution-oriented plays. And you have other new entrants not covered in the drilldown like Honeycomb and Observe. VMware is even getting into the act, positioning Tanzu around observability with a Kubernetes emphasis.
And there are dozens of other players in this space – it’s essentially “jump ball.”
Erik Bradley gives his final thoughts in this clip summarized below.
It’s such an interesting space. Even IBM, they go out and buy Turbonomic. Everyone seems to be playing. And not only that, the ones that are already playing are expanding. Datadog comes out and says, “Hey, we do security now.” And so I don’t really know where this is going to end, but there’s too much happening. There needs to be some sort of order out of the chaos. To your point about some of the emerging names, we just launched our Emerging Technology survey this week. Those are the ones where we’re going to see data on those new names, so stay tuned for that. We don’t track them in the core TSIS, which are more mature public vendors, but we will be getting some data on those emerging companies. But to your point, I really do believe that this space is rapidly expanding. And there’s a lot of growth still left.
In the panel yesterday I basically said to people, “How much of your infrastructure are you monitoring today versus how much you want to?” And the answer was around 65 to 70% being monitored now. And without a doubt they all want to get to a hundred percent. So there is still a lot of room to grow in this space, but I just don’t know if there’s enough room for all of these people that are basically going after the same percentage points. So what we’re seeing from a vendor strategy now is bundling. They’re trying to bundle, because that’s the way they’re going to actually gain that market share.
And just one last point to you for Elastic. A lot of people still view Elastic as a search functionality. So even though they have use cases and observability, I still think there’s a lot of people that got the ELK stack for enterprise search. So that is still kind of where they are, and maybe they’re not moving as fast as a Datadog or a New Relic in pure full stack observability.
Many thanks to our colleague Erik Bradley for his collaboration.
Keep in Touch
Remember, these episodes are all available as podcasts wherever you listen; just search Breaking Analysis Podcast. Check out ETR’s Web site for the survey data and analysis. We also publish a full report every week on Wikibon and SiliconANGLE.
Ways to get in touch: Email david.vellante@siliconangle.com | DM @dvellante on Twitter | Comment on our LinkedIn posts.
Watch the full video analysis:
Image credit: Tricky Shark
Note: ETR is a separate company from Wikibon/SiliconANGLE. If you would like to cite or republish any of the company’s data, or inquire about its services, please contact ETR at legal@etr.ai.
All statements made regarding companies or securities are strictly beliefs, points of view and opinions held by SiliconANGLE media, Enterprise Technology Research, other guests on theCUBE and guest writers. Such statements are not recommendations by these individuals to buy, sell or hold any security. The content presented does not constitute investment advice and should not be used as the basis for any investment decision. You and only you are responsible for your investment decisions.