Have you ever driven on the highway and traffic suddenly slows way down? And then after a little while it picks up again and you’re cruising along thinking…ok that was weird but it’s clear sailing now…only to find out in a bit that that traffic is building up again, forcing you to pump the brakes as the traffic patterns ebb and flow? Well welcome to the seesaw economy. The Fed induced fire that prompted a rally in tech is being purposely extinguished by that same Fed and virtually every sector of the tech industry is having to reset its expectations – including the cloud.
In this Breaking Analysis we’ll review the implications of this week’s earnings announcements from the big 3 cloud players. The growth of AWS and Azure slowed while Google Cloud Platform’s growth accelerated. We’ll explain why GCP’s growth is still not fast enough. We’ll update you on our quarterly IaaS forecasts and share the latest cloud survey data from ETR.
Early Warning Signals to the Quarterly Cloud Earnings
Before we get into the new data, we want to review something we shared with you on October 14th, just a couple of weeks back.
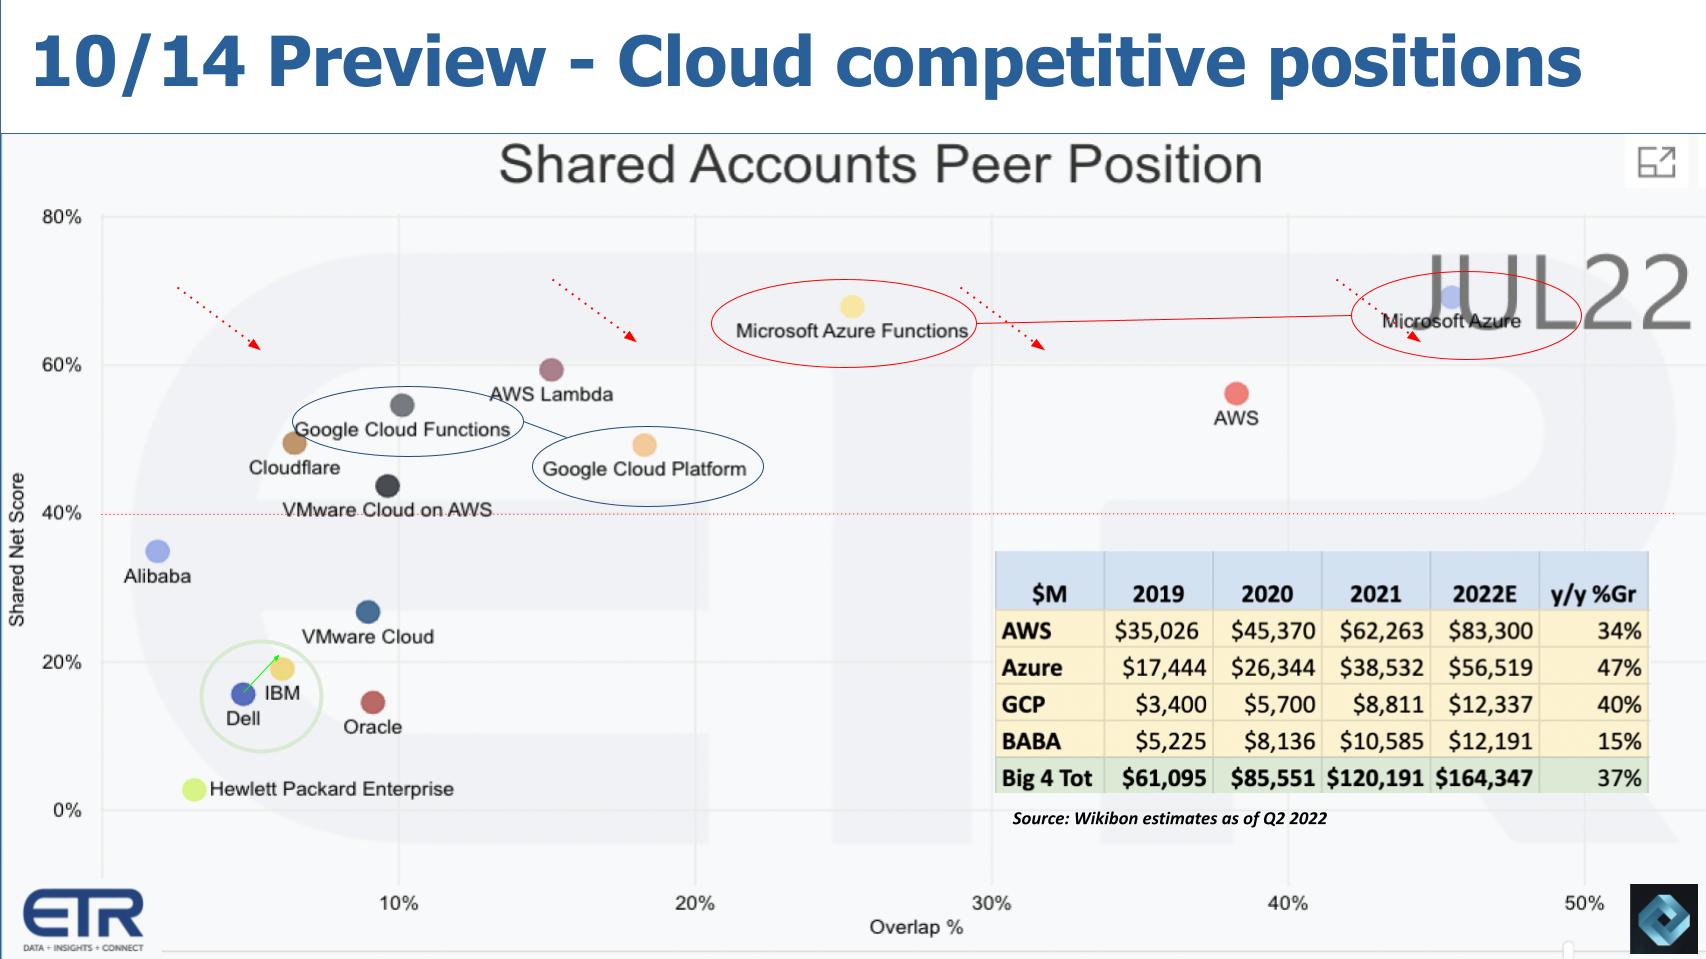
Above is sort of a “we told you it was coming” graphic. It’s an XY graph that shows ETR’s proprietary Net Score methodology on the vertical axis, that’s a measure of spending momentum and Overlap on the X axis, a metric depicting pervasiveness in the survey. The table insert shows the Wikibon Q2 estimates of IaaS revenue for the big 4 hyperscalers with their year on year growth rates.
We said at the time, this is data from the July ‘22 ETR survey and that ETR hadn’t publicly released its October results yet. And while we couldn’t share the specific data from October we were able to get a glimpse and we depicted the slowdown we saw in the October survey with the red dotted arrows seen above. The data indicated an across the board slowdown even for the big 3 cloud vendors.
Fast forward to this past week and we saw earnings releases from Alphabet, Microsoft and Amazon on Thursday after the close. Perhaps you’re thinking the ETR survey preview data didn’t really tell us anything we didn’t already know. But judging from the negative reaction of the stock market to these company’s earnings, the degree of softness surprised a lot of investors.
Updated Hyperscale IaaS Numbers
We didn’t update our IaaS forecasts at the time because of the proximity to earnings season. All of the big 4 with the exception of Alibaba have announced earnings, so we have most of the data today as shown below.
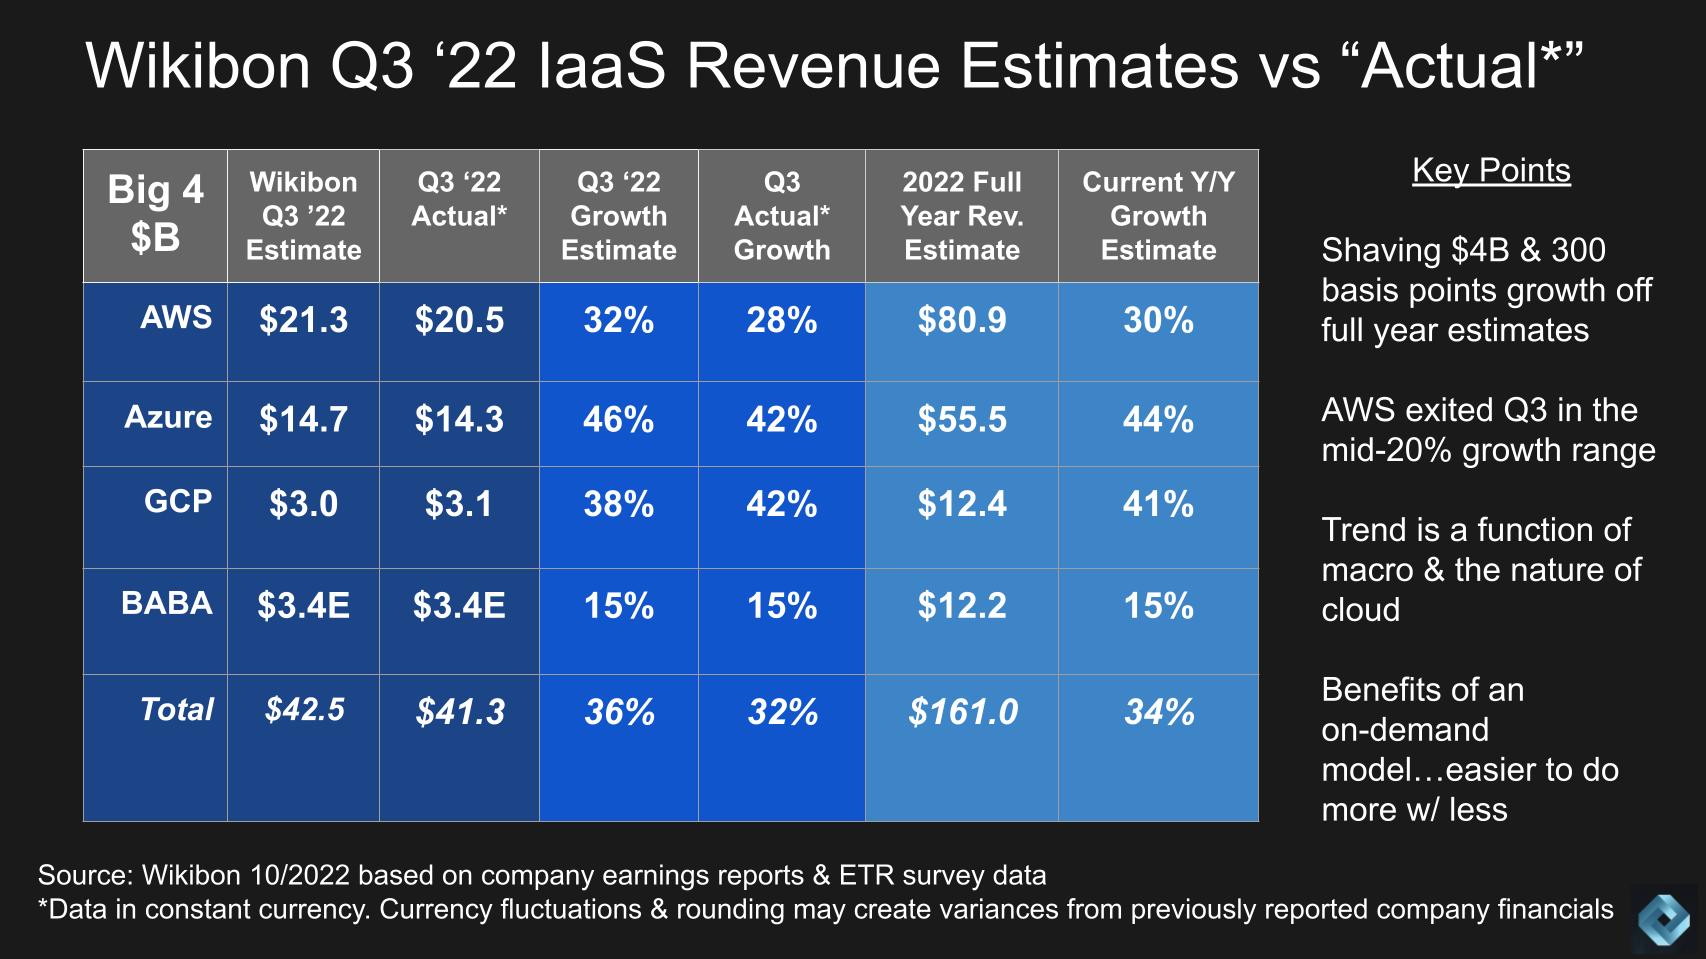
The chart above lays out our updated view of IaaS and PaaS worldwide revenue. The model we use tries to quantify cloud infrastructure, with an attempt to exclude SaaS revenue so we can make an apples-to-apples comparison across the clouds. “Actual” is in quotes because Microsoft and Google don’t report IaaS revenue, but they do provide clues and directional statements which we then triangulate with other data from the channel and ETR surveys to derive our figures.
The second column shows Wikibon’s previous estimates for Q3 and next to that we show our updated figures based on recent earnings. Same with the growth rates and then we round out the chart in the lighter blue color with our current full year estimate for revenue and year over year growth.
The key takeaways are the following:
- We shaved about $4B in revenue and roughly 300 basis points off growth from our full year estimates;
- AWS had a strong July but exited Q3 in the mid 20% growth range so we’ve reflected that in Q3 and are using that guidance for Q4, lowering our full year outlook for AWS but still topping $80B;
- Azure came in below our earlier estimates but we believe will surpass $55B for the year;
- Google Cloud Platform actually exceeded our expectations.
The compression in the numbers is in our view a function of the macro demand climate. We’ve made every attempt to adjust for constant currency so FX should not be a factor in this data. But it’s sure weighing on these companies’ income statements.
Customers are Optimizing Cloud Spend
The fundamental dynamic of a cloud model is you can dial it down when you need to. You may be thinking that many big cloud customers have a committed level of spending in order to get better discounts. And that’s true. But our research suggests that customers are reallocating and optimizing that committed spend. For example shifting data to lower cost storage tiers or increasingly taking advantage of better price performance processors like Graviton for example. As well, we see smaller companies that were paying by the drink (strictly on demand) moving to reserved instances to lower their cloud bills.
Instead of taking the easy way out and just spending more, customers are reallocating their spending to control costs. So they’re spending time and effort optimizing, whereas during the pandemic many companies were not as focused on that effort because business was booming and they had to respond.
So in general, cloud customers are doing more with less (or the same).
A Look at Historical Cloud Growth Rates
While hyperscale growth rates are well off historical highs, we’ve seen unprecedented patterns over the past fifteen quarters.
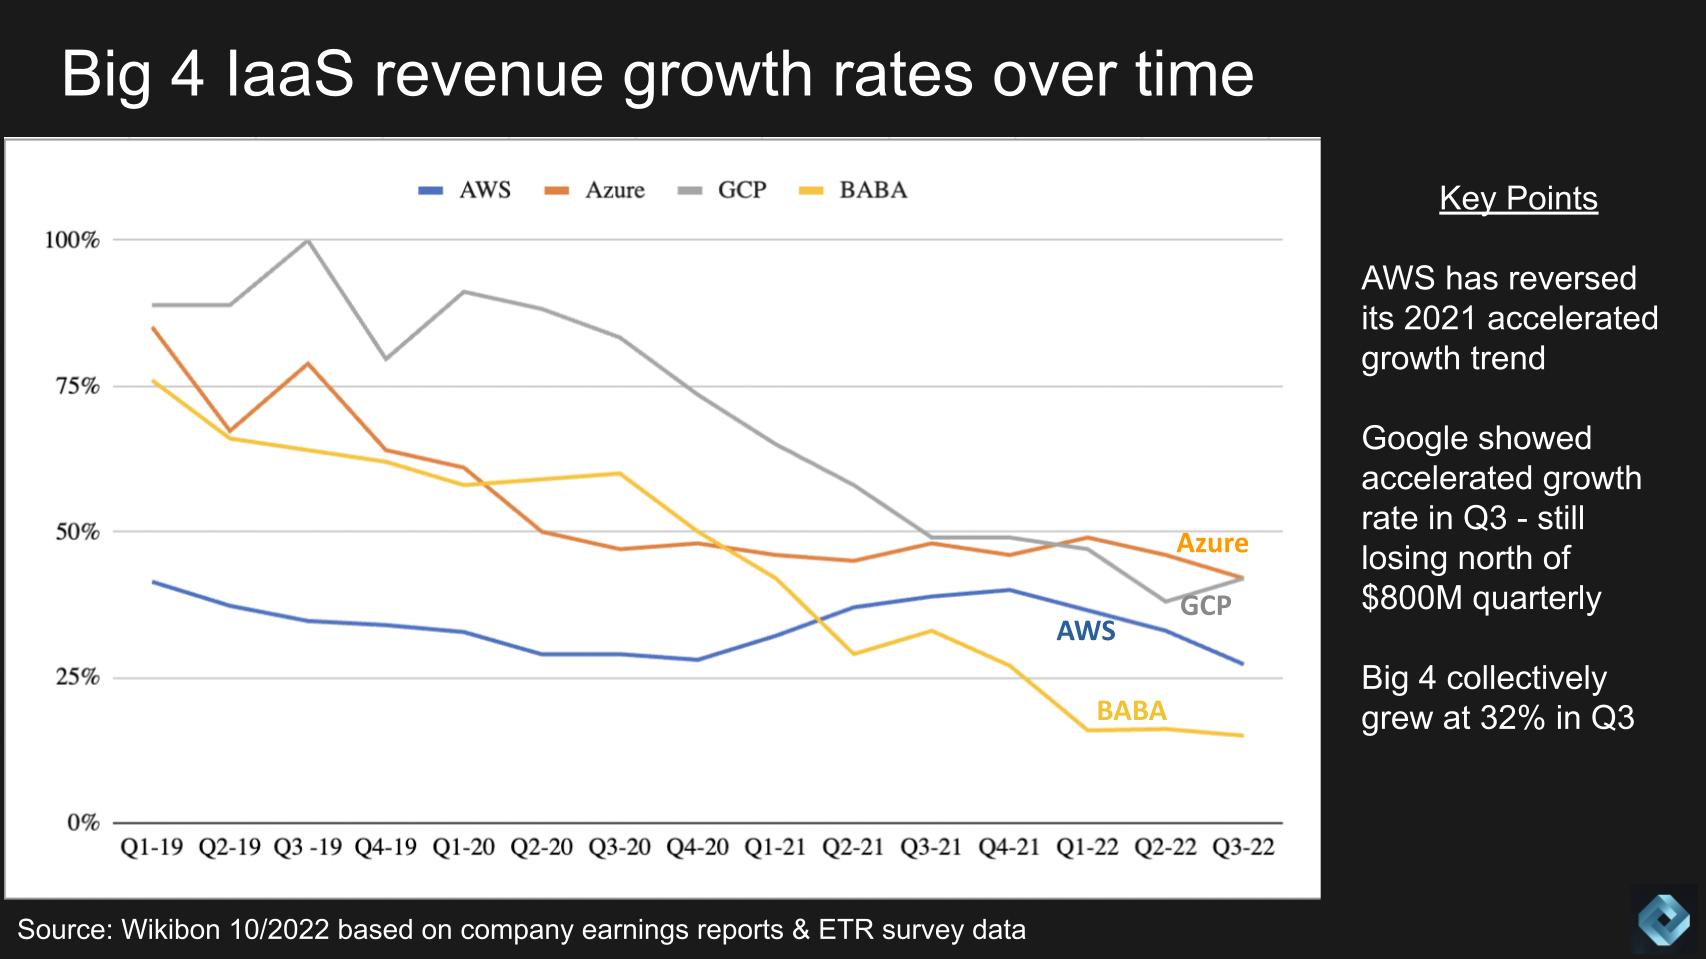
The data above shows worldwide quarterly revenue growth rates back to Q1 2019. Several observations are worth noting:
- During the pandemic, you saw both AWS and Azure buck the law of large numbers and actually accelerate growth;
- AWS especially saw progressively increasing growth rates throughout 2021 – a trend that has reversed in 2022;
- We saw Azure come down this past quarter but it’s still growing in the low 40’s (constant currency);
- Google Cloud Platform actually saw an uptick in growth rates as GCP becomes an increasingly large portion of Google’s overall cloud business. [Note: Google cloud continues to lose north of $850M per quarter whereas AWS and Azure are extremely profitable cloud businesses].
- Collectively, the big 4 hyperscalers grew revenues 32% in Q3 year over year (constant currency).
Alibaba is likely suffering China market woes and we’ll see how the numbers come in when they report in mid-November.
Thirty-two Percent Revenue Growth Doesn’t Sound Like Repatriation
The slowdown in our view isn’t due to repatriation or competition from on-prem vendors. In our view it’s a function of both macro-related issues and cloud spend optimization initiatives. Cloud will continue to significantly outperform other sectors despite its massive size. On the repatriation point, it simply doesn’t show in the data. The A16Z article from Sarah Wang and Martin Casado, asserting repatriation was inevitable as a means to lower cost of goods sold for SaaS companies was thought-provoking but thus far hasn’t moved the needle in the numbers.
Now in fairness to the authors, they did make the following statement in their piece:
And so, with hundreds of billions of dollars in the balance, this paradox will likely resolve one way or the other: either the public clouds will start to give up margin, or, they’ll start to give up workloads. –Sarah Wang and Martin Casado
Dig into the financial statements of both AWS and its partners like Snowflake, you’ll see there are ongoing negotiations to rebalance their cloud costs. AWS, and no doubt execs at Azure and GCP, understand that the lifetime value of a customer is worth much more than near term gross margin. You can expect the cloud vendors to strike a balance between profitability and customer retention. They’re not going to give up key workloads.
Google is not Growing Fast Enough
Even though Google Cloud Platform saw accelerated growth this past quarter we need to put that in historical context.
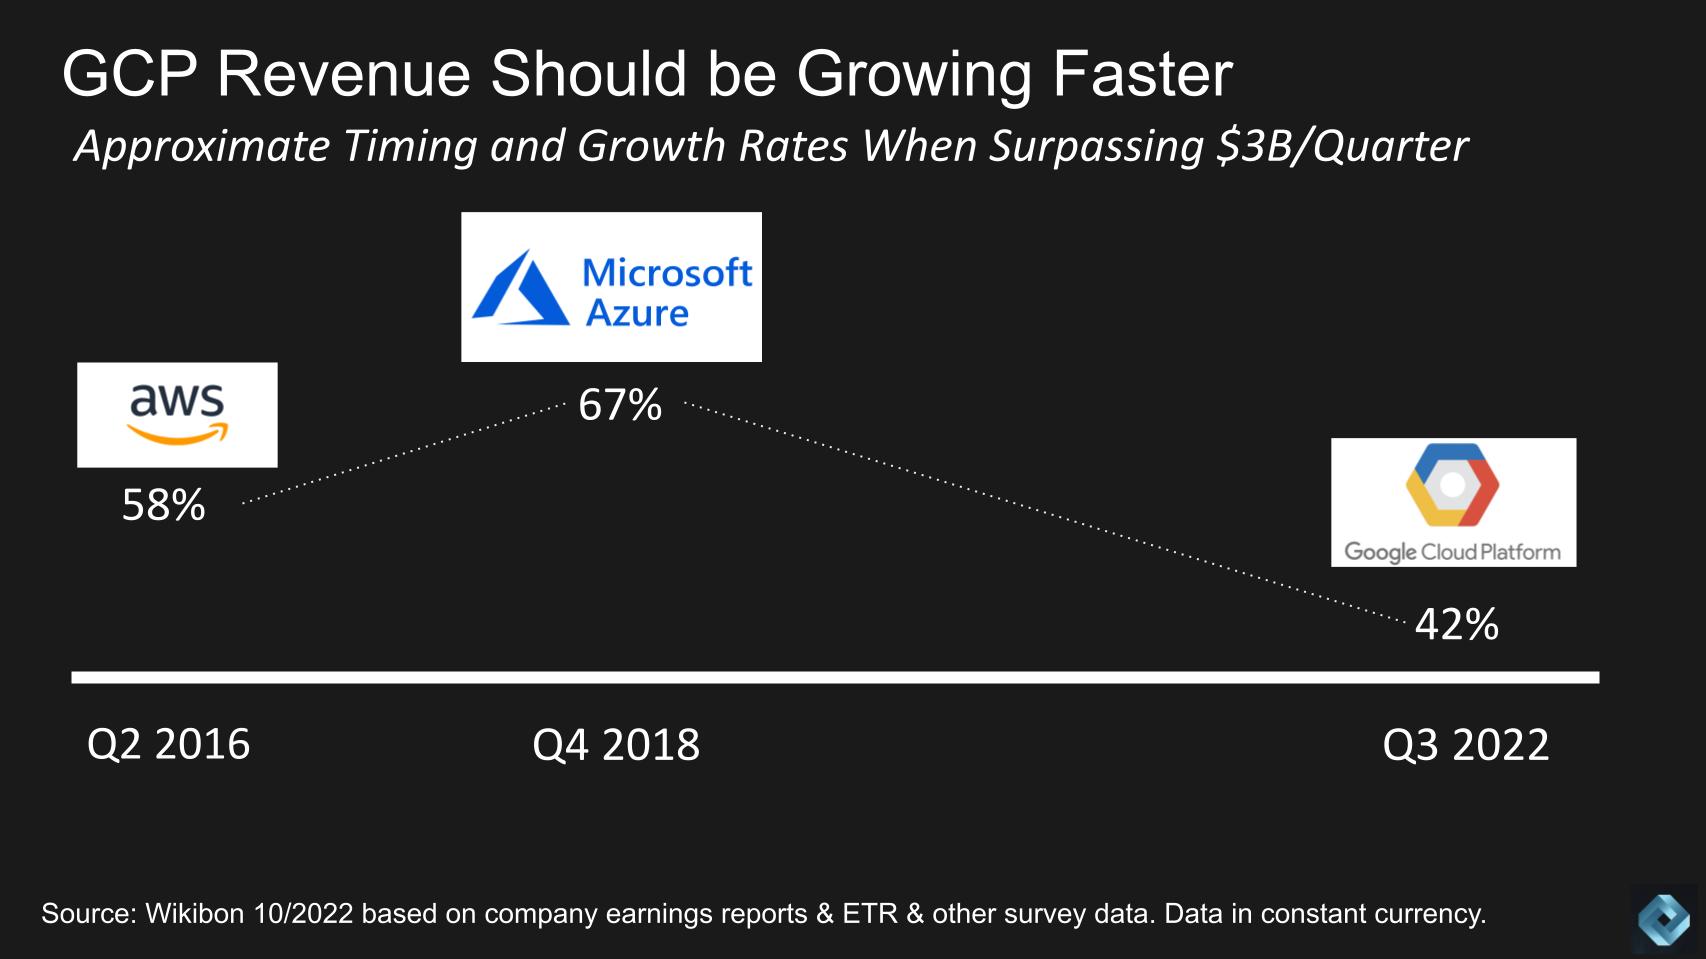
GCP by our estimates has now broken through the $3B per quarter mark. It actually did so earlier this year but its growth rate accelerated to 42% this past quarter and that’s a good sign in our view. So we’ll use the higher growth rate of this quarter to give Google the benefit of the doubt.
Let’s do a quick growth comparison with AWS and Azure when each crossed the $3B milestone.
AWS hit $3B per quarter back in Q2 2016. At the time it was growing at 58%. Azure by our estimates crossed that mark in Q4 2018 and was growing at 67% at the time. One would expect in the most recent quarter that Google’s growth rate would be significantly higher than its competitors. It’s not really. But even more telling is looking at history, you’d like to see GCP’s growth rate at this point of the maturity model at least over 50%, which we don’t believe it is.
One more point on this topic. Our business friend Matt Baker often says it’s not a zero sum game, meaning there’s plenty of opportunity to build value on top of hyperscalers. We would totally agree – it’s not a dollar for dollar swap if you can innovate.
History will show, however, that the first company in the pool makes the most money. Number two can do really well and number three tends to break even. Now maybe cloud is different because you have Microsoft’s software estate powering its IaaS business. And Google ads are funding technology buildouts for GCP. So we’ll see how that plays out but right now, by this one measurement, Google is almost four years behind Microsoft and six years behind AWS. AWS and Azure are highly profitable businesses while Google Cloud is on pace to lose $3B on an operating basis this year.
The Spending Profiles on the Big 3 Clouds Remain Impressive
To the point that cloud will continue to outpace other markets let’s break this down in spending terms to see why that claim holds water.
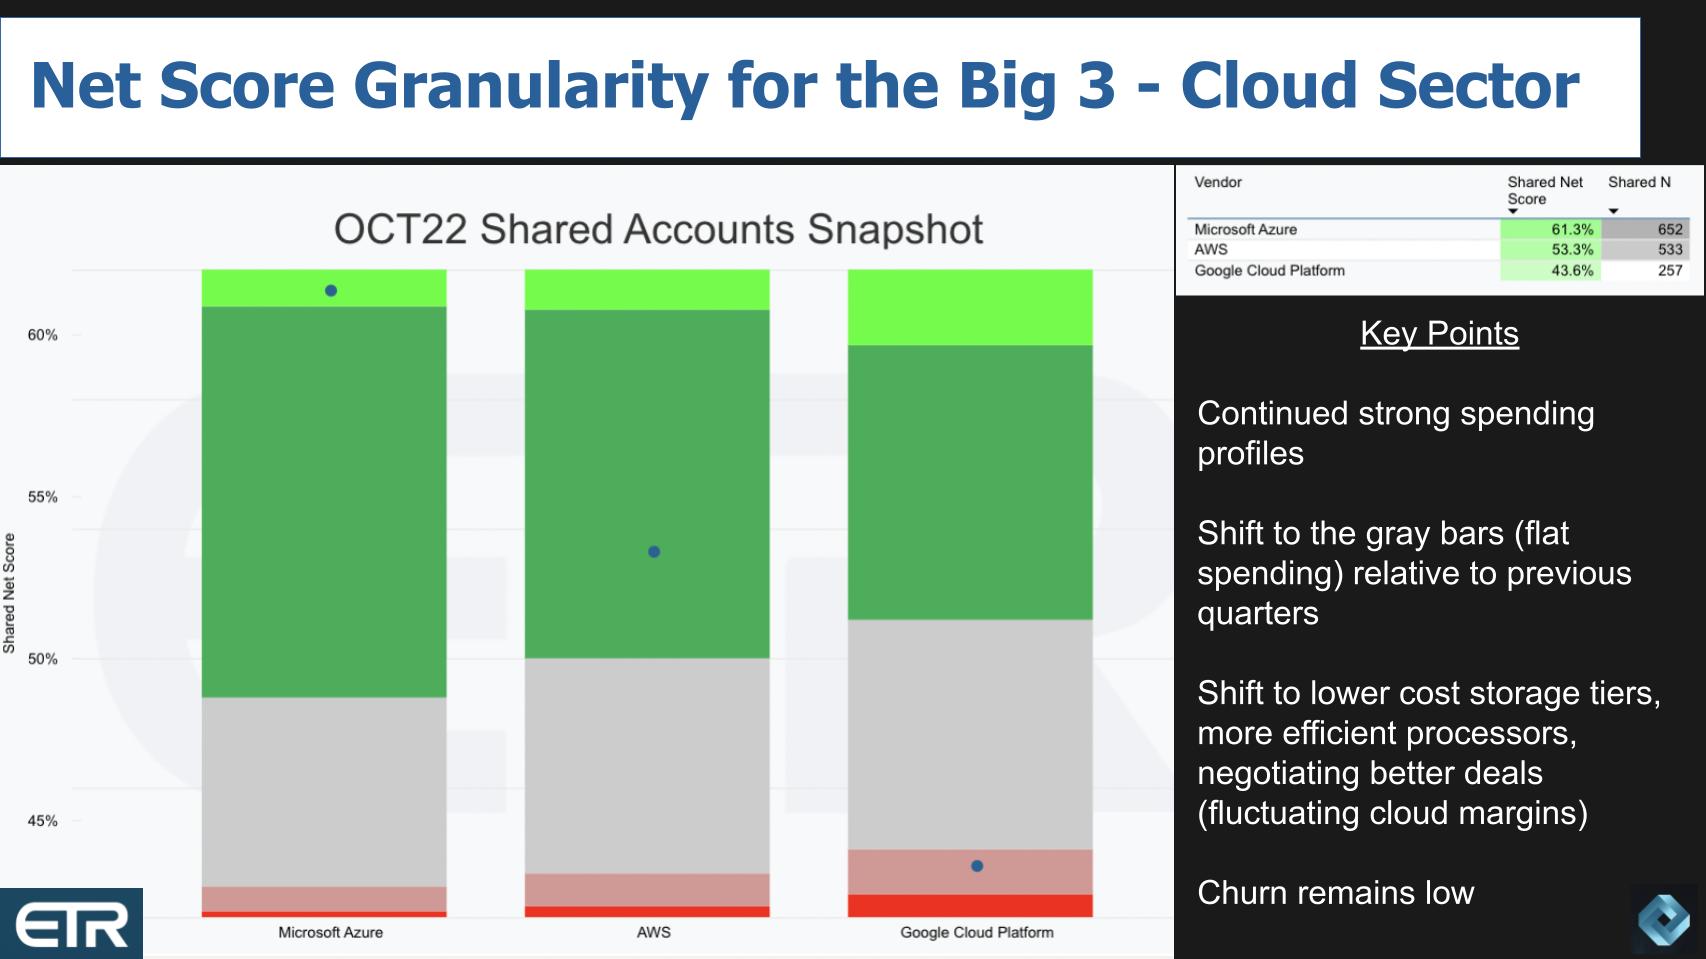
The data above is from ETR’s latest October survey and shows the granularity of its Net Score or spending velocity metric. The lime green is new adoptions, the forest green is spending more, the gray bars represent flat spend, the pinkish colors represent spending less and the bright red show defections or churn off the platform. Subtract the reds from the greens and you get Net Score which is that blue dot on each set of bars.
What you see in the table insert is all three have Net Scores above 40%, which is a highly elevated score. Microsoft’s Net Score is above 60%, AWS is well into the 50s and GCP is in the mid 40s. All really good.
What’s happening with all three is a higher percent of customers is keeping cloud spending flat and that’s what’s accounting for most of the compression. As we pointed out earlier, cloud spend optimization is a less disruptive option (relative to pre-cloud) that customers have when things get soft. But the really important metrics is churn – the bright red. For all three – even GCP – churn is in the low single digits.
Again – customers aren’t repatriating in droves. It’s just not a trend we would bet on. Maybe makes for good FUD or marketing head fakes but it’s just not a big deal in the grand scheme of things.
And you can’t help but be impressed with both Microsoft and AWS’ performance in the survey. It mirrors what we see in the marketplace. As we mentioned before, these companies aren’t going to give up workloads to try and preserve a little gross margin. They’ll do what it takes to keep people on their platforms because they’ll make it up over time with added services and improved offerings. Once these companies acquire a customer they will be very aggressive about keeping them.
The Million Dollar Coffee Cup
Customers, take note…you probably have some negotiating leverage so use it. Perhaps that’s one of the most significant benefits of multi-cloud and an opportunity for Google.

Many readers may not know the story of the million dollar coffee cup. IBM in its day was more dominant than Microsoft or Amazon. At one point IBM accounted for 50% of IT industry revenues and 66% of its profits. The vast majority of its monopoly power stemmed from control of the mainframe market.
Amdahl was a competitor that built IBM compatible mainframes that were cheaper and offered better price performance, albeit two years after IBM shipped a new product. While Amdahl only had single digit market share it was a profitable business because IBM’s margins were so obscene.
When an Amdahl sales rep visited a customer he or she would hand the prospect a branded coffee cup before leaving and say “this cup is worth a million dollars.” The prospect would ask why and the rep would explain that when the IBM sales rep saw that the company was considering Amdahl, they’d get a $1M discount.
The analog to that coffee cup in today’s modern cloud world is actually running workloads in other clouds and demonstrating proficiency in doing so. Such that if you have to threaten to leave a platform to get a more favorable deal you actually have the expertise to back up the claim.
Cloud Remains the Most Important Market Force Today
Let’s look at another cut at the cloud market from the ETR data set.
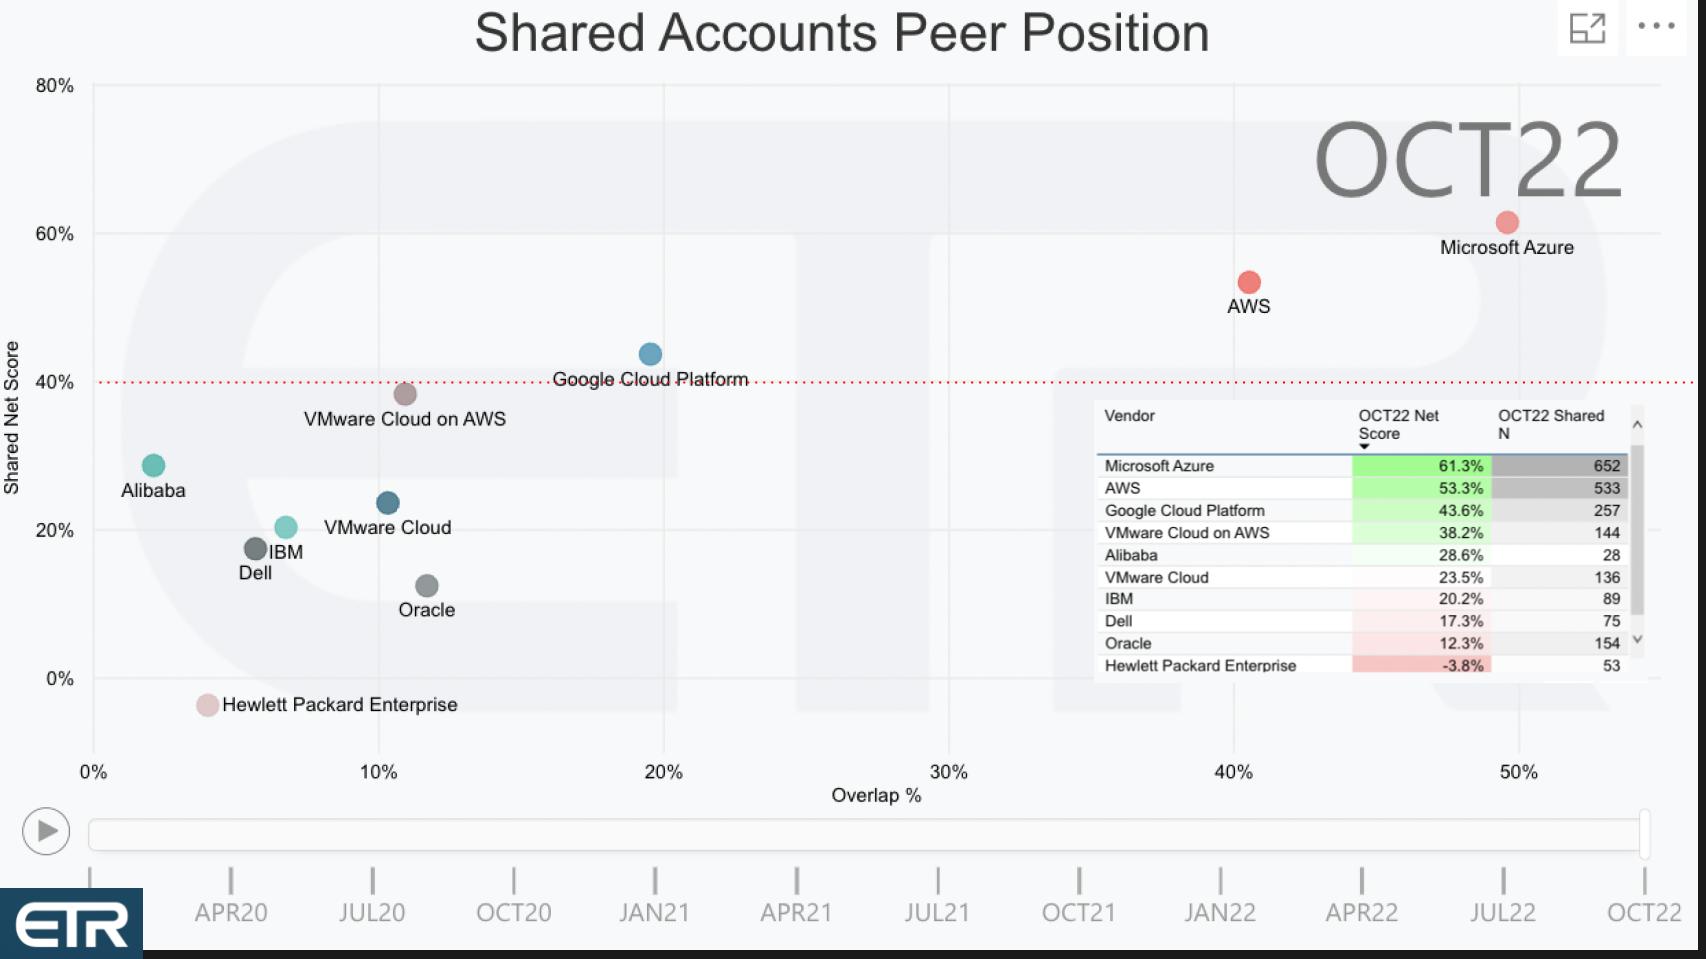
Above is the two dimensional view again with Net Score or spending momentum on the vertical axis plotted against presence in the data which is the horizontal axis. This is a view of ETR’s cloud computing sector with that magic 40% red dotted line highlighted. The table insert shows how the dots are plotted. With Net Score against presence (i.e. Ns).
Notably, only the big 3 hyperscalers are above the 40% line. There are others like Snowflake which we’re not showing that would be even higher than any of these names but we’ll dig into that in a later episode.
This data is another way of quantifying the dominance of AWS and Azure not only relative to Google but the other cloud platforms out there. We’ve plotted IBM and Oracle which both own a public cloud. Their performance is largely a reflection of them migrating their installed bases to their respective clouds. And that’s fine – they’re in the game. But they simply don’t have the business momentum of AWS and Azure. Which is quite impressive because AWS and Azure are now as large or larger than IBM and Oracle and to show this type of continued growth at that size is remarkable.
That said, customers are starting to recognize the viability of on-prem/hybrid clouds like HPE’s GreenLake and Dell’s APEX. And IBM is doing well with its hybrid theme monetizing its Red Hat acquisition. You may say “that’s not cloud” but if the customers think it is we’ll continue to report this view.
We’re not sure what’s happening with HPE…they had a big downtick this quarter in the survey and we wouldn’t read too much into that because their N is still pretty small at 53. Big fluctuations are not uncommon with those small N’s. We did notice a big negative for HPE within the giant Public / Private sector which is often a bellwether. It could be an outlier because when we dig deeper into the data we see HPE cloud looks strong within the Fortune 1000. So we’ll continue to monitor that.
You should also note VMware’s strong presence in the data – both for VMware Cloud on AWS and its own on-prem/hybrid, multi-cloud services. Broadcom CEO Hock Tan released a blog post last week emphasizing the importance of VMware’s multi-cloud strategy and the viability in his mind of Tanzu as an enabler of modernization and cross-cloud services.
Why the Rally in Tech?
So where’s this leave us?
The action in the stock market Friday on the heels of some soft earnings reports is notable. Is it an encouraging sign that the worst is over or is this just another bear market head fake?
Once again we asked friend of Breaking Analysis and long time trader Chip Symington to weigh in and give us his take. Here’s a summary of what he sees:
There are a lot of fund managers chasing performance right now and it wouldn’t be surprising to see a big up day to open next week. October has been a big month in recent history. The fact that the GDP number was actually positive and not a big mess caught some people by surprise. And there’s a faction of investors that believe the market is starting to discount a recovery in the economy in six months.
But I think this is just a strong rally in a bear market. There’s a lot of pent up demand right now and the fact that the market was able to shrug off Amazon’s negative guide underscores that demand. Overall technology is the most important group for real growth and those numbers have been tepid. In my view it would be hard to see a real rally or a bottom without some better tech guidance.
So the tactical story of currency and macro headwinds will likely continue to be a dominant theme until global economies settle down. The visibility from tech companies is still murky as most are guiding down, which indicates that their conservative outlook last quarter was still too optimistic.
But as it relates to cloud – that platform is not going anywhere any time soon. Sure there are potential disruptors on the horizon, especially at the edge, but we’re still a long ways off from the possibility that a new economic model emerges from the edge to disrupt the cloud.
And the opportunities in the cloud remain strong. What other path is there really? Private cloud was a band-aid until the on-prem guys could get their as-a-service models rolled out – which is just now happening. The hybrid thing is real, but it’s mostly defensive for the incumbents until they can get their supercloud investments going. Supercloud implying adding value above the hyperscaler CAPEX. Call it “what multi-cloud should’ve been” or metacloud or uber cloud – whatever you like. But there are opportunities to play offense and that’s clearly happening in the cloud ecosystem with the likes of Snowflake, Mongo, Hashicorp, Hammerspace, Aviatrix, Crowdstrike, Zscaler, Okta…and even the projects we see coming out of enterprise players like Dell with Project Alpine and what Pure Storage is doing along with a number of the backup vendors like Cohesity and Veeam.
So Q4 should be really interesting but the real story is the investments companies are making now to leverage the cloud for digital transformations will be paying off down the road. This is not 1999 where you maybe had some good ideas (and admittedly a lot of bad ones too) but you didn’t have the infrastructure to service customers at a low enough cost. The cloud is that infrastructure and so far it’s been transformative.
It’s likely the best is yet to come.
Keep in Touch
Thanks to Chip Symington for his contributions to this Breaking Analysis. Alex Myerson and Ken Shiffman are on production, podcasts and media workflows for Breaking Analysis. Special thanks to Kristen Martin and Cheryl Knight who help us keep our community informed and get the word out. And to Rob Hof, our EiC at SiliconANGLE.
Remember we publish each week on Wikibon and SiliconANGLE. These episodes are all available as podcasts wherever you listen.
Email david.vellante@siliconangle.com | DM @dvellante on Twitter | Comment on our LinkedIn posts.
Also, check out this ETR Tutorial we created, which explains the spending methodology in more detail.
Watch the full video analysis:
Note: ETR is a separate company from Wikibon and SiliconANGLE. If you would like to cite or republish any of the company’s data, or inquire about its services, please contact ETR at legal@etr.ai.
All statements made regarding companies or securities are strictly beliefs, points of view and opinions held by SiliconANGLE Media, Enterprise Technology Research, other guests on theCUBE and guest writers. Such statements are not recommendations by these individuals to buy, sell or hold any security. The content presented does not constitute investment advice and should not be used as the basis for any investment decision. You and only you are responsible for your investment decisions.
Disclosure: Many of the companies cited in Breaking Analysis are sponsors of theCUBE and/or clients of Wikibon. None of these firms or other companies have any editorial control over or advanced viewing of what’s published in Breaking Analysis.