Stock market recoil pulls the rug out from many tech investors. Leaving them wondering what’s next?
The steepest drop in the stock market since June 11th flipped the narrative and sent investors scrambling. Tech got hammered after a 2-month run and people are asking questions. Is this a bubble popping or a healthy correction? Are we now going to see a rotation into traditional stocks like banks and certain cyclicals that have lagged behind the technology winners?
In this week’s Breaking Analysis we want to give you our perspective on what’s happening in the technology space and unpack what this sentiment flips means for the balance of 2020 and beyond. As always we’ll reference survey and model data from ETR to support our opinions.
What Happened on September 3rd 2020
The tech markets recoiled this week as the NASDAQ composite dropped almost 5% in a single day. Apple’s market cap alone lost $178B. The big four, Apple, Microsoft, Amazon and Google lost a combined value that approached a half a trillion dollars. For context this number is larger than the gross domestic products for countries as large as Thailand, Iran, Austria, Norway and the UAE. And many more.
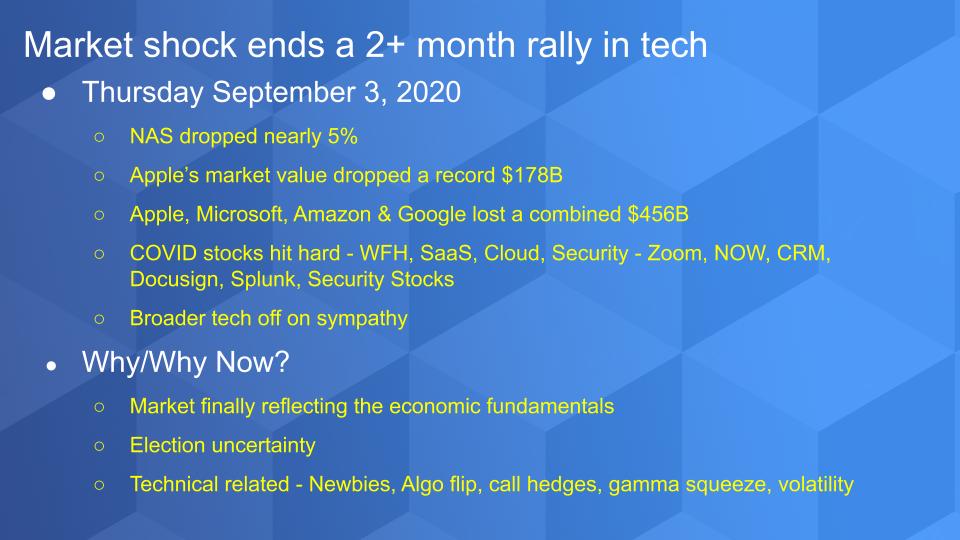
The tech stocks that have been running due to COVID got crushed. These are the ones we’ve highlighted as best positioned to thrive in the pandemic. The work from home, SaaS, Cloud and security stocks. We’re talking about names like Zoom, ServiceNow, Salesforce, Docusign, Splunk and the security names like Crowdstrike, Okta and Zscaler. By the way, Docusign Crowdstrike and Okta all had nice earnings beats but still got killed, underscoring the sentiment shift.
The broader tech market was off on sympathy and this trend appears to be continuing into the Labor Day holiday.
Millennial Options Run & SoftBank’s $50B Leveraged Options Play
There are many opinions on this. First, many like us are relatively happy because this market needed to take a break. As we have said before, the stock market is not reflecting the realities of the broader economy. As we head into September in an election year, uncertainty kicks in. But it really looks like this pullback was fueled by a combination of an overheated market and technical factors.
Specifically, volatility indices were high yet markets kept rising. Robinhood millennial investors who couldn’t bet on sports realized that investing in stocks was as much of a rush and potentially more lucrative. The other big wave, which was first reported by the Financial Times, is that SoftBank made a huge bet on tech and bought options tied to around $50B worth of high flying tech stocks.
So the options call volume skyrocketed. The call vs put ratio was getting way too hot. And we saw an imbalance in the market. Market makers will often buy an underlying stock to hedge call options to ensure liquidity in these cases.
To be more specific. Delta in options is a measure of the change in the price of an option relative to the underlying stock. And gamma is a measure of the volatility of the delta. Usually volatility is relatively consistent on both sides of the trade – calls and puts – because investors will hedge their bets. But in the case of many of these hot stocks – like Tesla for example, you’ve seen the call skew be much greater than the skew on the downside.
So for example, if people are buying cheap out of the money calls, a market maker might buy the underlying stock to hedge for liquidity. Then if Elon puts out some good news, the stock goes up, market makers have to buy more of the underlying stock, then algos kick in to buy more, and then the price of the call goes up as it approaches its at the money price. This forces the market makers to keep buying more of the underlying stock and the melt up continues.
Until it stops and the market flips like it did this week. When stock prices begin to drop, market makers will rebalance their risks and sell their underlying stocks and then the rug gets pulled out from the market for these stocks that have run.
Ok well why did I spend so much time on this? And why am I not freaking out. Because I think these market moves are largely technical versus fundamental. It’s not like 1999 where you had a double whammy of technical rug pulls combined with poor underlying fundamentals for high flying companies like CMGI and Internet Capital Group – whose business was all about placing bets on dotcoms that had no business models other than non-monetized eyeballs.
Epic Run in the NAS
Below is a YTD chart of the NAS. You can see it bottomed on March 23rd at 6860. Then ran up until June 11th and had that big drop but was still elevated at 9492. Then it ran up to over 12,000 and an all time high. And then the big drop.
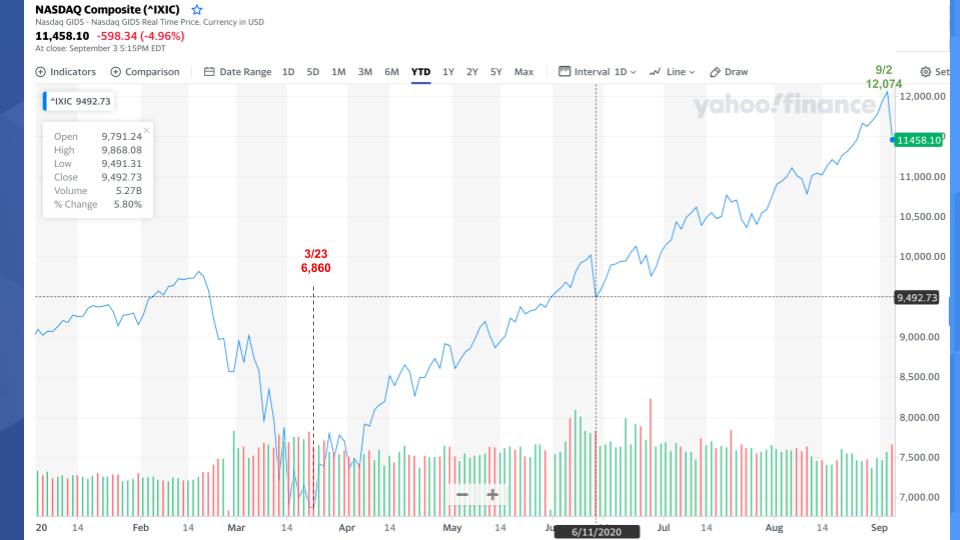
And the trend continued on Friday morning. The NASDAQ composite traded below 11,000. It actually corrected to 10% off its high – 9.8% to be precise. And then it snapped back but pulled back again at the close of day.
But even at its low, that’s still up over 20% for the year. In the year of COVID – would that have surprised you in March?
So to us this pullback is a relief. It’s good and actually very normal and predictable. The exact timing of these pullbacks on the other hand is entirely unpredictable.
Where from Here?
The economy continues to get better. The August jobs report was good with 1.4 million new jobs and 340K coming from the government. Those are positive numbers and translate into a drop in unemployment to 8.4%. This is good relative to expectations and yet the selloff continued which suggested the market wanted to keep correcting. So good, maybe some buying opportunities will emerge over the next several months for those that have been waiting. But then the market snapped back so we will see.
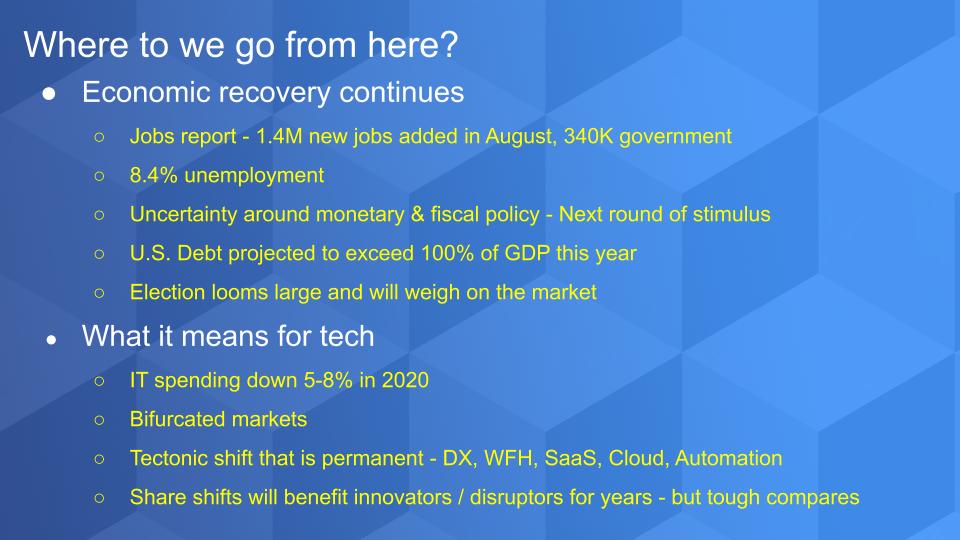
But we think there are more opportunities ahead because there’s so much uncertainty. What’s going to happen with the next round of stimulus. The jobs report could be a catalyst for a compromise between the Democrats and Republicans.
U.S. debt is projected to exceed 100% of GDP this calendar year. Does that give you a good feeling?
And we talked about the election already. So lots to think about.
What’s in Store for Tech?
As we’ve been projecting for months with our colleagues at ETR, despite the stock market’s rise and some real tech winners, we still see a contraction in 2020 IT spend of 5 to 8 percent. And we talk a lot about the bifurcation in the market due to COVID accelerating trends that were already in place – i.e. Digital transformation, SaaS and cloud but then WFH kicked in other trends including video conferencing and a shift in security spend.
And we think this will continue for years. However because these stocks have run up so much, they are going to have very tough compares in 2021.
The IT Spending Macroeconomics
The data below is from a series of surveys ETR conducted to better understand spending patterns due to COVID. The yellow slices of the pies show the percent of customers that indicate that their budgets will be impacted by Coronavirus. And you can see the steady increase from mid March to June – from 63% saying yes to 78%.
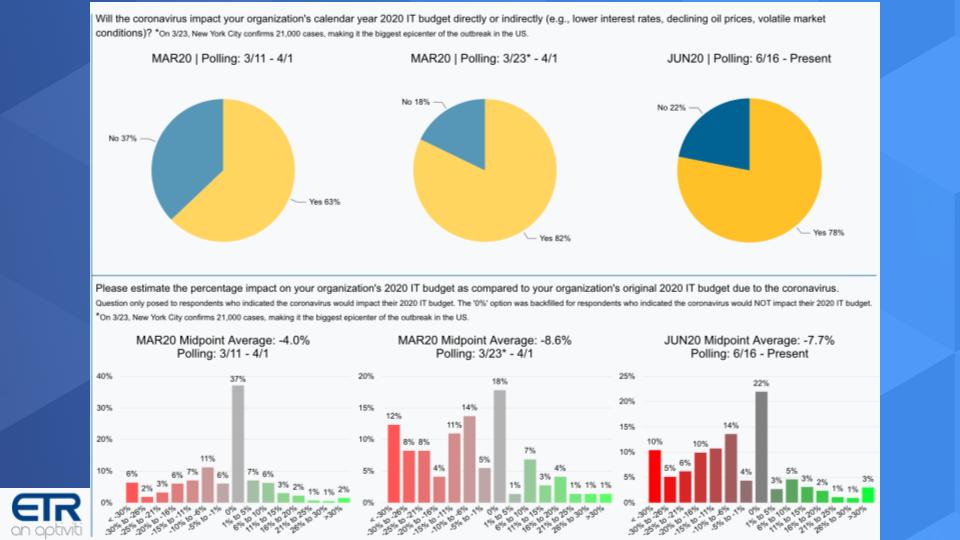
The bottom part of the chart shows the degree of change. 22% say no change in the latest survey but you can see much more of a skew to the red declines on the left versus the green upticks on the right of the charts.
IT Spending Responds to the Pandemic
The chart below shows what companies are doing as a result of COVID.
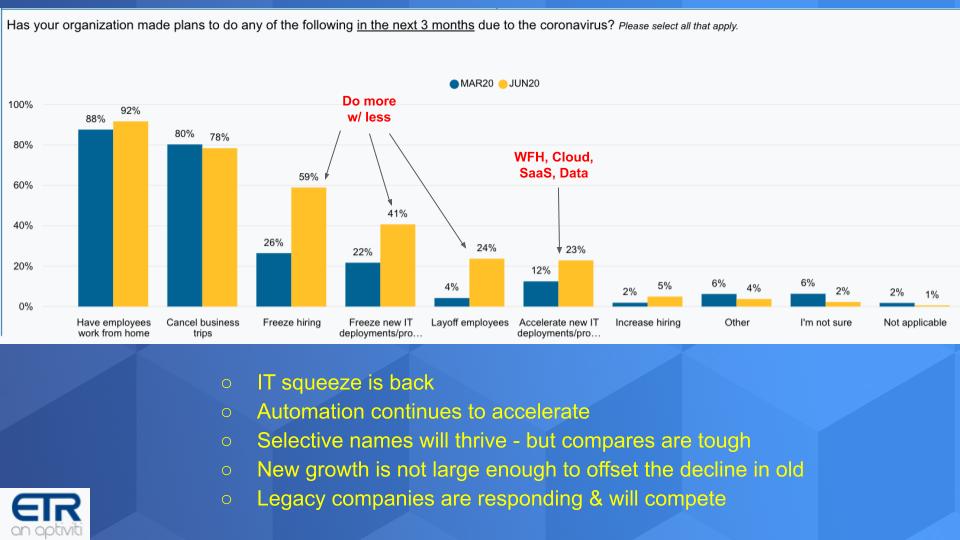
Of course everyone’s working from home and not traveling (first two bar categories). We know that. But look at the increases in hiring freezes, freezing new IT deployments and the sharp rise in layoffs. So IT is again being asked to do more with less.
We see this driving an acceleration to automation and that will benefit the RPA players, cloud providers and modern software vendors. And it will precipitate a tailwind for more aggressive AI implementations.
And many other selected names are going to continue to do well, which we will discuss in a second. But they are in the WFH, Cloud, SaaS and modern data sectors.
But the problem is those growth sectors are not large enough to offset the declines in the core businesses of the legacy players – who have a much higher market share. So overall the IT spend declines.
Now where it gets interesting is the legacy companies all have growth businesses. IBM has its hybrid cloud business and Red Hat. Dell has VMware and work from home solutions, Oracle has SaaS and cloud, Cisco has its security business, HPE has its as-a-service initiative and so forth. And again, these businesses are growing faster, but they are not large enough to offset the declines in core on-prem legacy and drive anything more than flat growth overall at best…and by the time they are large enough we will be on to the next big thing.
But these legacy companies will compete with the upstarts and that’s where it gets a bit fuzzy for market forecasters.
Some of the Tech Momentum Plays
We’ll start with one of our favorites below – Snowflake. Who along with Asana and JFrog, Sumologic and Unity has a highly anticipated upcoming IPO.
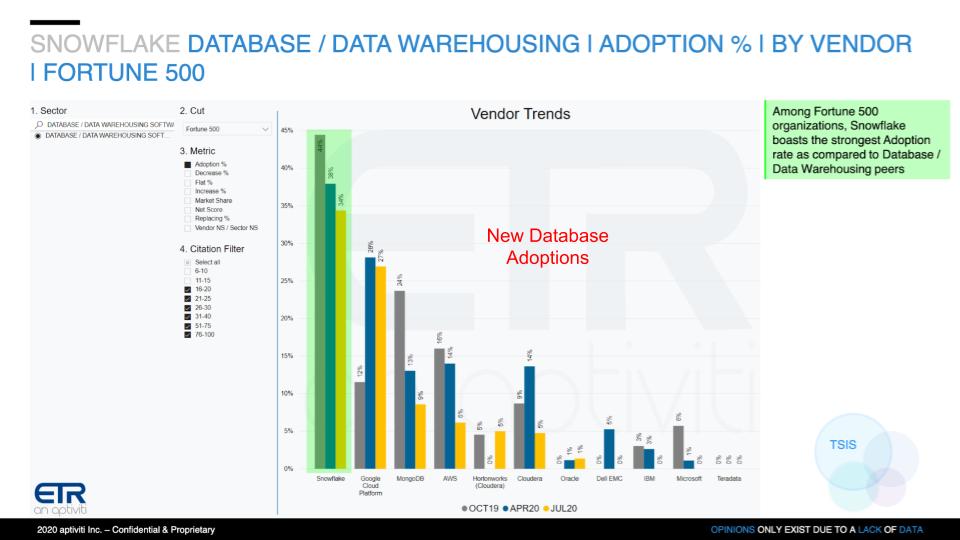
This chart shows new adoptions in database. And you can see that Snowflake, while down from the Oct 19 survey, is far outpacing its competitors with the exception of Google, where BigQuery is doing very well. Mongo and AWS remain strong and I’m actually encouraged that it looks like Cloudera has righted the ship and you saw this in their earnings recently. But my point is that Snowflake is a share gainer and will likely continue to be one for a number of quarters and years if they can execute and compete with the big cloud players – a topic we’ve covered extensively in previous Breaking Analysis episodes. We think they can.
The Automation Mandate
This is another space we’ve covered a lot focusing on two leaders, UiPath and Automation Anywhere. But we still like Blue Prism and we especially like Pegasystems, which has for years been embarking on a broader automation agenda.

The chart above shows Net Score or spending velocity data for those customers who said they were decreasing spend in 2020 – those red bars we showed earlier. And you can see both AA and UiPath show elevated levels. Microsoft as we’ve reported is elbowing its way into the market with what is currently an inferior product but it is Microsoft so we can’t ignore them.
Remote Work = Tailwinds for Select Security Firms
The chart below cherry picks a few of our favorite names and shows the Net Score granularity for some of the leaders and emerging players.
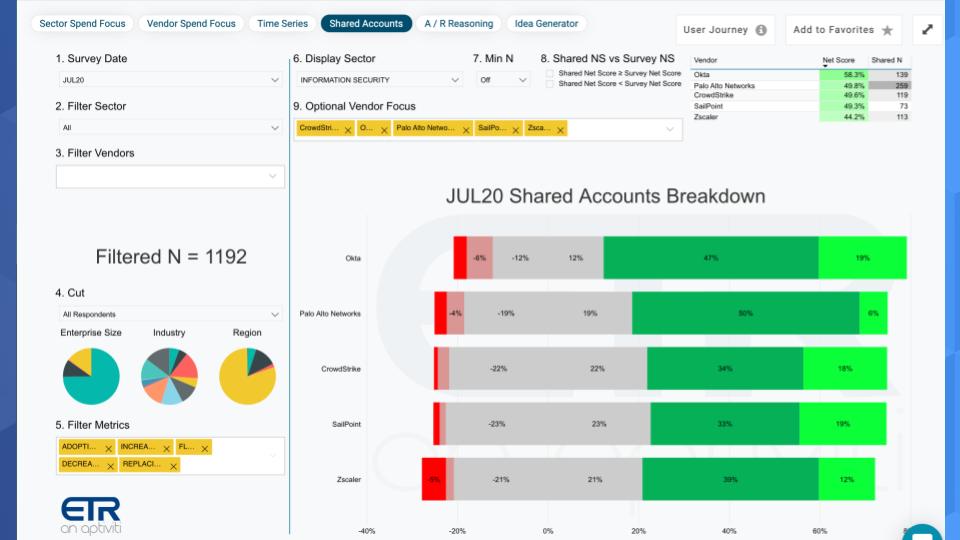
All these players are in the green as you can see in the upper right and they all have a decent presence in the data set based on the N’s. Okta is at the top of the list with a 58% Net Score. Palo Alto is a more mature player but still has an elevated Net /Score. Crowdstrike’s Net Score dropped this quarter which is a bit of a concern but it’s still high. Followed by Sailpoint and Zscaler who are right there. The big three trends in this space right now are cloud security, identity access management and endpoint security. And we think these trends have legs.
Now everyone on this chart has reported earnings except Zscaler which reports on September 9th. And all of these companies are all doing well and exceeding expectations. But as I said earlier, next year’s compares won’t be so easy. Oh and their stock prices all got killed as a result of the rug pull that I explained. So we really feel this isn’t a fundamental problem for all of these firms – it’s more technical.
AA and UiPath we don’t know because they are not public and we think they need to get their house in order so they can IPO…so we’ll see when they make it to public markets – we don’t think that’s an if…they will IPO but the fact that they haven’t filed yet says they’re not ready. Why wouldn’t you IPO if you were ready in this market – despite the recent pullback.
Thoughts for New Investors
Ok all you new investors out there that think you’re a stock picking pro. Any fool can make money in a market that goes up every day. But trees don’t grow to the moon. There are bulls, bears and pigs and pigs get slaughtered. And I could throw a dozen other cliches at you. But we are excited that you’re learning. Maybe you made a few bucks playing the options game – it’s not as easy as you may think. We hope you don’t trade on margin.
But look – we think there will be some buying opportunities ahead– there always are. Be patient. It’s very hard – actually impossible – to time markets and we’re fans of dollar cost averaging. And young people making less than $137,000 a year – LOAD UP ON YOUR ROTH IRA. It’s a government gift that we wish we could’ve tapped when we were newbie investors. And as always do your homework.
Remember these episodes are all available as podcasts – please subscribe. We publish weekly on Wikibon.com and Siliconangle.com so check that out and please do comment on the LinkedIn posts we publish. Don’t forget to check out ETR for all the survey action. Get in touch on twitter @dvellante or email david.vellante@siliconangle.com. And remember, Breaking Analysis posts, videos and podcasts are all available at the top link on the Wikibon.com home page.
Thanks everyone, be well and we will see you next time.
Watch the full video analysis: