Is robotic process automation overhyped or the next big thing?
Welcome to this week’s episode of Wikibon’s CUBE insights, powered by ETR. In this Breaking Analysis we take a deeper dive into the world of robotic process automation or RPA, one of the hottest sectors in software today.
In this session we want to address three questions:
- Is the RPA market overvalued?
- How large is the total available market (TAM) for RPA?
- Who are the winners and losers in this space?
RPA Market Snapshot
Before we address the first question, here’s what you need to know about RPA, summarized in the chart below.
The market is small but its growing fast. Wikibon estimates that the software-only revenue for the space was about $1B dollars worldwide in 2019 and its growing at 80-100% annually.
RPA has been popular in larger companies especially in the back office and in regulated industries like financial services. RPA has been successful at automating mundane, repeatable, deterministic tasks and most automations are unattended today, meaning bots complete tasks without human interaction.
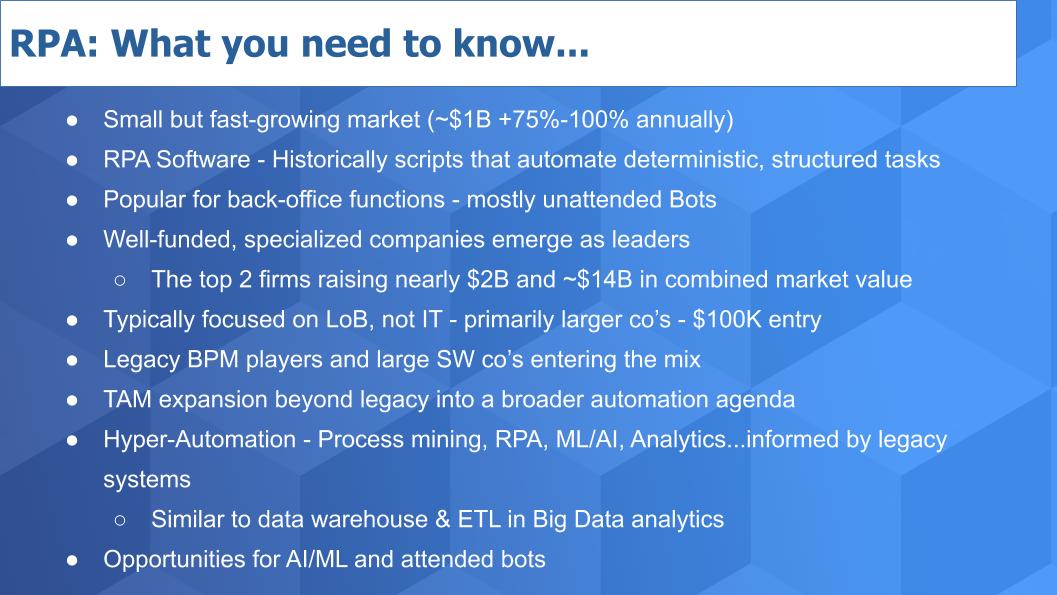
Top RPA Players are Well-Financed
The industry is well-funded with the top two firms raising nearly $2B in the past couple of years with a combined market value of nearly $14B. Some people in theCUBE community have said that RPA is hyped and looks like a classic “pump and dump” situation. We are going to look into that in more detail and share some valuation and customer data to try and come to some conclusions in that regard.
We see big software companies like Microsoft and SAP entering the scene and we will comment on that later on in this analysis.
RPA players have cleverly succeeded in selling to business lines and often have bypassed IT, which sometimes creates tension in organizations. As we stated, customers are typically large organizations that can shell out the $100K plus entry point to get into the RPA game.
Expanding TAM
The total available market (TAM) is expanding beyond the back office into a broader automation agenda. “Hyper Automation” is the buzz word of the day and there are varying definitions. Gartner looks at hyper automation as the incorporation of RPA with intelligent business process management iBPM and iPaaS or intelligent platform as a service. Gartner’s definition takes a holistic view of the enterprise – incorporating legacy on prem apps and emerging systems.
This is good but we question whether the “hyper” term applies to this definition as we see hyper automation as the extension of RPA to include process mining, to discover new automation opportunities, and the use of ML and AI applied to process data…where that combination drives intelligent analytics that further drive digital business process transformation across the enterprise.
So we envision a more agile framework and definition for hyper automation. We see legacy BPM systems informing the transformation but not necessarily adjudicating the path forward. We liken this to the early days of big data where legacy data warehouses and ETL processes provided useful context but organizations had to develop a new tech stack that broke the stranglehold of technical debt. We’re seeing this emerge today in the big data/analytics space in the form of new workloads powered by emerging analytic databases like Red Shift and Snowflake– with ML tools and cloud driving agile insights.
We think a similar renaissance is happening with automation driven by the mandate for digital business transformation. With ML and AI tooling applied to data, more automation across the enterprise and augmentation with attended bots at scale. In other words we see RPA moving beyond what we sometimes call “paving the cowpath” use cases – i.e. automating mundane processes that may be outdated – to a much more transformative platform to drive digital business process transformation.
Is the RPA Space Overvalued?
We want to address the question: Is the RPA market over hyped and over valued? To answer this – lets go through a bit of a thought exercise and look at some data.
This chart below shows some critical data points that will begin to help answer the question. In the top part of the chart we show the company, money raised, projected valuations and revenue estimates for 2019 and 2020. As you can see, UiPath and Automation Anywhere are the hot companies right now. They’re private so much of this data is estimated but we know how much money they’ve raised and the valuations that have been reported. So the RPA software market checked in at around $1B last year and we have it almost doubling this year.
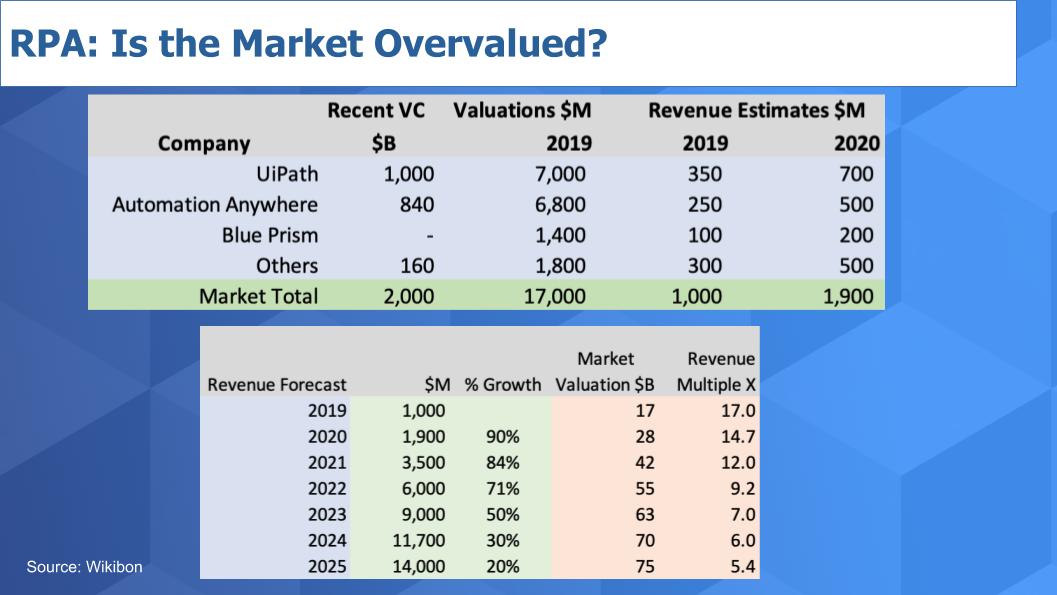
The bottom part of the chart above shows projected market revenue growth and the implied valuations for the market as a whole. So you can see today we show a market that is trading at around 17 times revenue…which seems like a very high multiple. But over time we show that multiple shrinking and settling in mid decade at just over 5X – which for software is pretty conservative, especially for a market growing as fast as RPA is projected to grow.
Now what we’ve done on this next chart below is brought down that market growth and implied valuation data (the top part of the chart above) and highlighted 2025 at 75 billion dollars. The market growth will have slowed to 20 percent in this thought exercise with a revenue multiple of 5.4 X for the market.
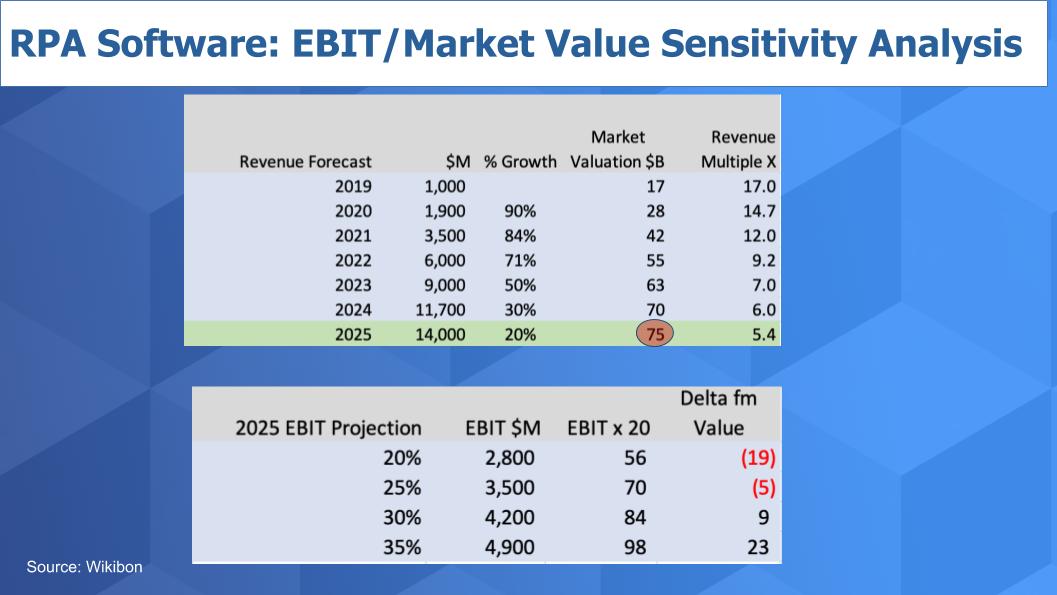
On the bottom chart above, we’re bringing in the notion of profit for the market. Eventually, as market growth slows, RPA software will start to throw off profits – at least it had better. So what we show above is a sensitivity analysis assuming 20%, 25%, 30% and 35% EBIT for the market. And we calculate a 20X EBIT multiple (i.e. Valuation divided by EBIT) which for a market growing this fast is reasonable in our view. Consider that tech overall will typically have a multiple of 10-15 percent so an emerging software market growing at 20% should be able to deliver that type of valuation.
[Note: We understand that enterprise value (EV) over EBIT is a more accurate measure but this is back of napkin to answer the question and we’re not getting into the balance sheet in this forecast, so we’re using market capitalization as the metric.]
And you can see in the far column above, (“Delta from Value”) we show the delta from our $75B valuation target at the respective EBIT levels. Given these assumptions we are well within the range of that $75B market valuation.
Of course, in reality you’re going to have some companies growing faster than the market and we will see some consolidation, but at the macro level it would seem that the company which can lead will win the spoils and these figures actually suggest the market could be undervalued.
We realize at these valuations it may sound crazy but look at the history of other disruptive software companies like ServiceNow and Workday. And we note Snowflake’s recent valuation at $12B. So we feel to the extent that RPA can break out of the back office, these valuations are justified, if the market is large enough to support this type of growth.
As well, the revenue in this space is increasingly moving toward annual recurring revenue (ARR), which both depresses actual recognized revenue (relative to a perpetual software license / maintenance model) but at the same time drives much more predictable income statement performance. ARR is the holy grail of software valuations today.
Estimating the RPA TAM
In the section above, we’re trying to address the question: Are the valuations for UiPath and Automation Anywhere justified?
In our view it depends in a large part on the size of the total available market and the ability to break out of a back office niche and deliver the types of revenue figures we forecast. Maybe our forecasts are too aggressive but in our experience the traditional forecasts tend to underestimate transformative technologies. We will see.
But let’s look more closely at the TAM. Let’s start with customer viewpoint. Here’s a clip of Eric Lex, an RPA pro at GE, talking about his company’s RPA journey.
Eric Lex comments on GE’s RPA journey.
Not coincidentally, this is a story shared by many customers and we’ve tried to reflect it in some detail with the graphic below.
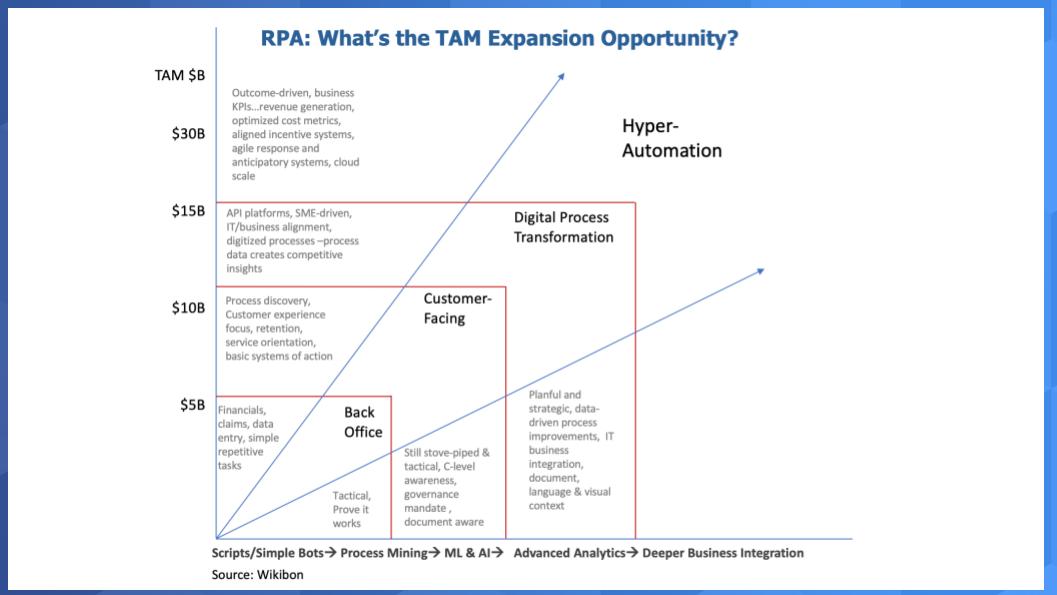
What Eric Lex shared is very typical. Start small, get some wins, show the ROI, educate people that automation is good for them, prove out the tech in the back office and then drive customer facing and more transformative activities. We see this as the beginning point for more SME-driven (subject matter expert) digital transformations where business line pros are rethinking processes and developing new automations – either in low code scenarios or with centers of excellence.
This vision of hyper automation we think comes from the ability to do process mining and identify automation opportunities, then bring RPA to the table using machine learning and AI to understand text, voice, visual context and ultimately use that process data to transform the business. We see an outcome-driven model where organizations are optimizing on business KPIs and incentives are aligned accordingly. Often organizations measure the number of bots or processes automated but the real driver will be business metrics, not RPA metrics.
The bottom line is we see this vision potentially unlocking a very large TAM…that potentially exceeds well over thirty billion dollars globally.
What does the Spending Data Say About the RPA Market Overall?
Let’s bring in some of the spending data and take a look at what ETR tells us about this market. The chart below shows the spending momentum for RPA relative to other initiatives within the Global 2000.
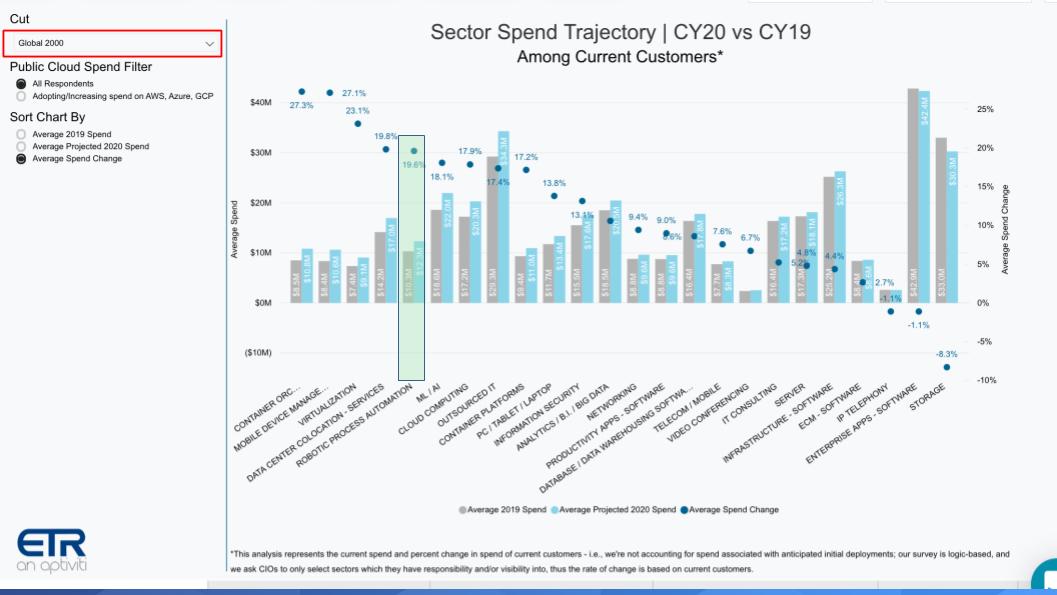
The first thing that jumps out in the chart above is RPA is one of the fastest growing segments in the ETR data set. You can see in the green box the blue dot at almost 20 percent is the change in spending velocity in the 2020 survey versus last year. The one caveat is we’re isolating on Global 2000 companies in the data set as you can see in the red bar on the upper left.
We stress that RPA today is really hot in large companies but not as fast-growing when you analyze all the respondents including smaller organizations.
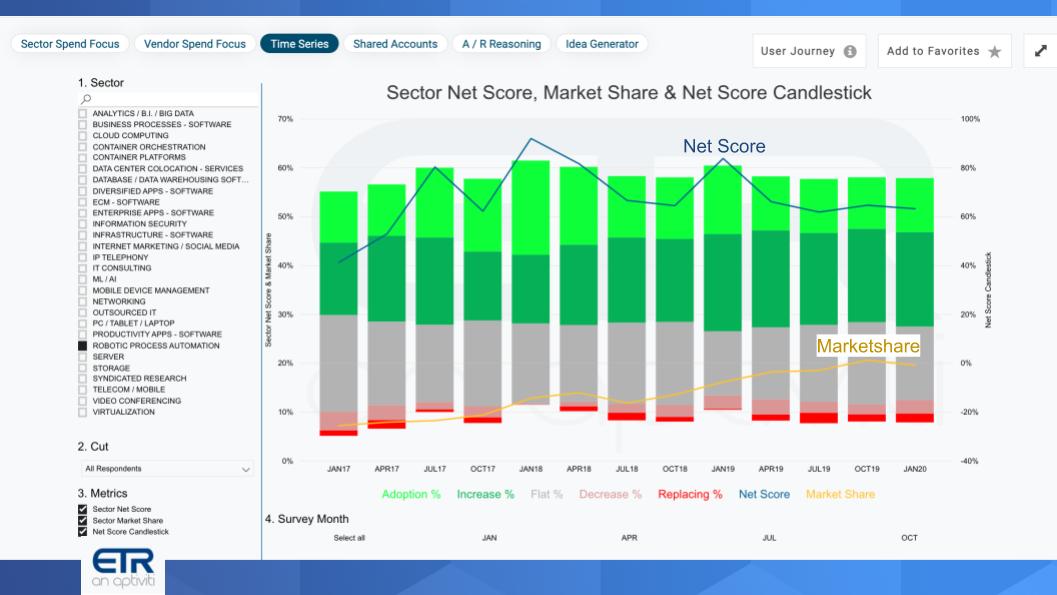
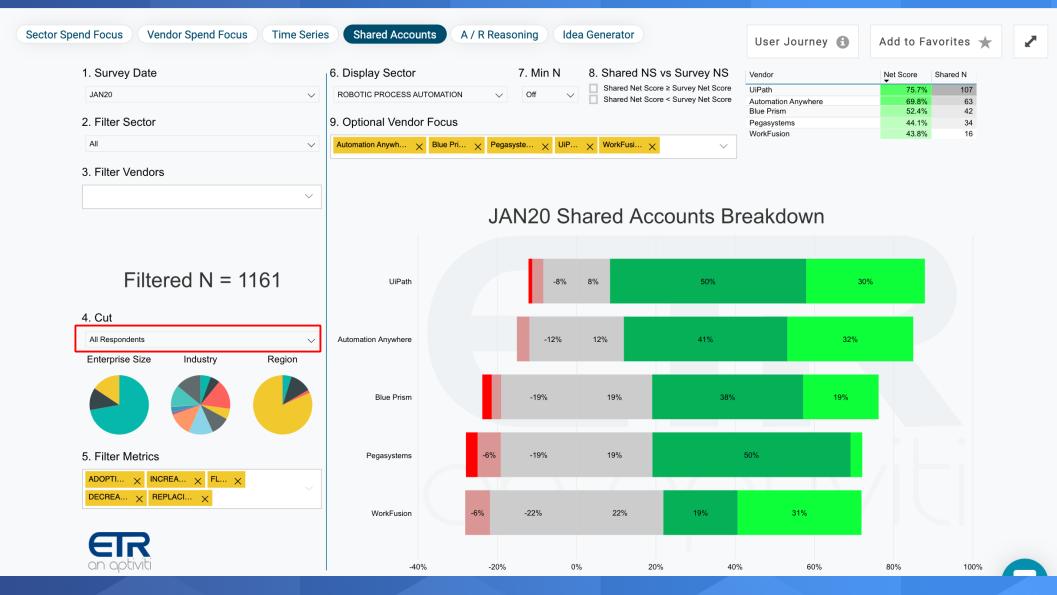
Nonetheless – this chart below shows Net Scores and Market shares for RPA across all respondents, including smaller companies– and the segment is still showing strength. Remember Net Score is a measure of spending velocity and Market Share is a measure of pervasiveness in the survey. And you can see below, the RPA Net Scores holding steadily and the Market Share continuing to creep up over time…despite a slight dip in this survey. As we showed in the Global 2000 cut above, that is not the case in large organizations, RPA continues its steady march in that segment.
Who are the Winners and Losers in the RPA Market
Next we want to explore the ETR data to understand who is winning in the space.
The chart below shows is Net Score or spending velocity on the Y-axis and Market Share or pervasiveness on the X-axis for each player captured in the RPA space. As we run the sequence from the January 18 survey through today – across nine surveys look at UiPath and Automation anywhere – but UiPath in particular. They appear to really be breaking away from the pack.
Run the sequence to see how company positions change over time:
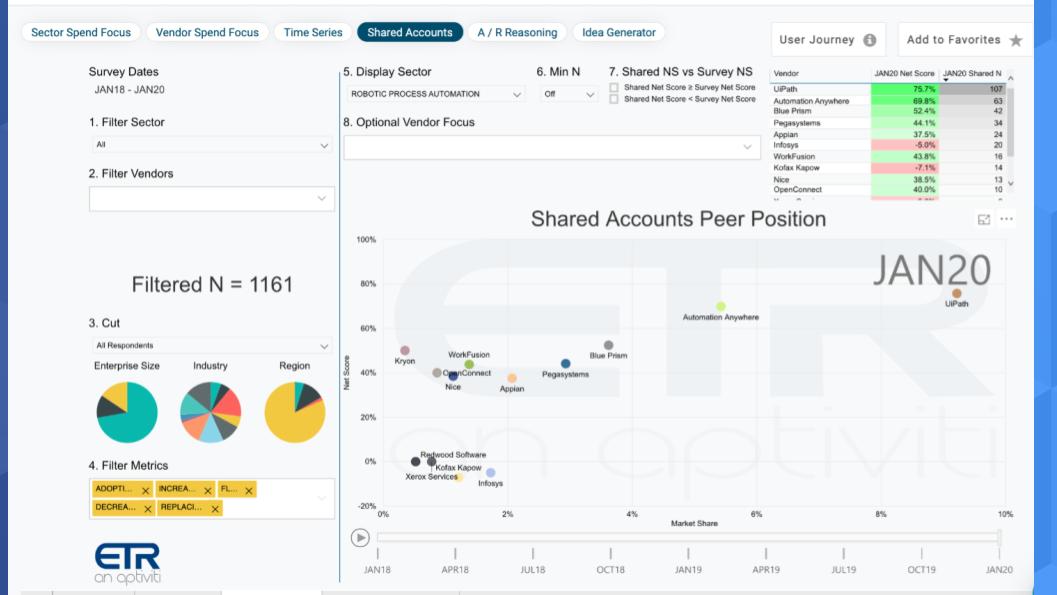
Below we have another cut at the data. It shows Net Scores or spending velocity for UiPath, Automation Anywhere, Blue Prism, Pegasystems and WorkFusion. These are all very strong Net Scores as you can see in the upper right – all in the green. Net Score is essentially calculated by subtracting the percent of customers spending less from those spending more. The two leaders – UiPath and AA are strongest but all the rest are actually quite good.
RPA Adoption is Stronger in the Global 2000
The chart below shows what happens when we isolate on 349 Global 2000 respondents in the ETR survey. UiPath jumps into the 80% territory for Net Score or spending velocity. Automation Anywhere dips a bit, Pegasystems jumps up nicely but look at Blue Prism – they fall back in the larger G2000 accounts which is of some concern.
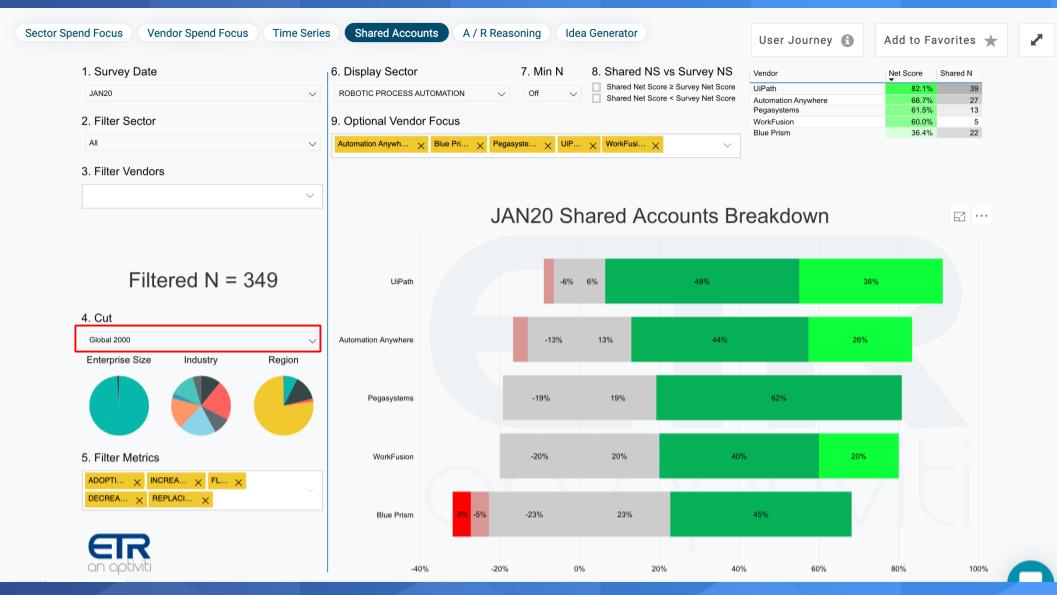
The other key point on this chart above is that 85% of UiPath customers and 70% of Automation Anywhere customers plan to spend more this year than last year. That is pretty impressive.
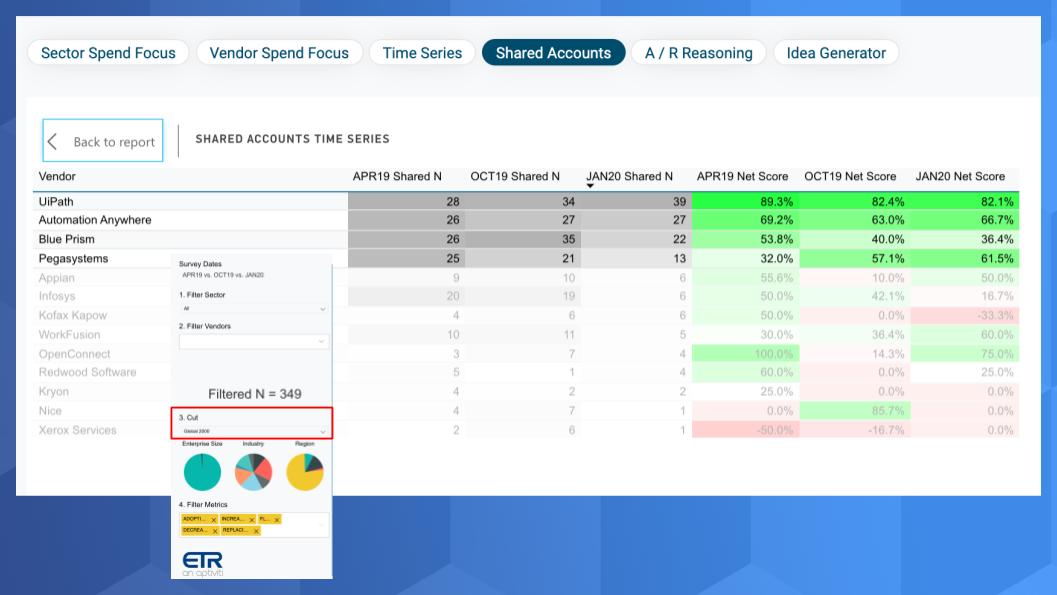
And as you can see here in the chart below, the Global 2000 have been pretty consistent spenders on RPA for the past three survey snapshots. UiPath again showing Net Scores or spending intensity solidly in the 80% plus range. And even though it’s a smaller N you can see Pega with a nice uptick in the last two surveys within these larger accounts.
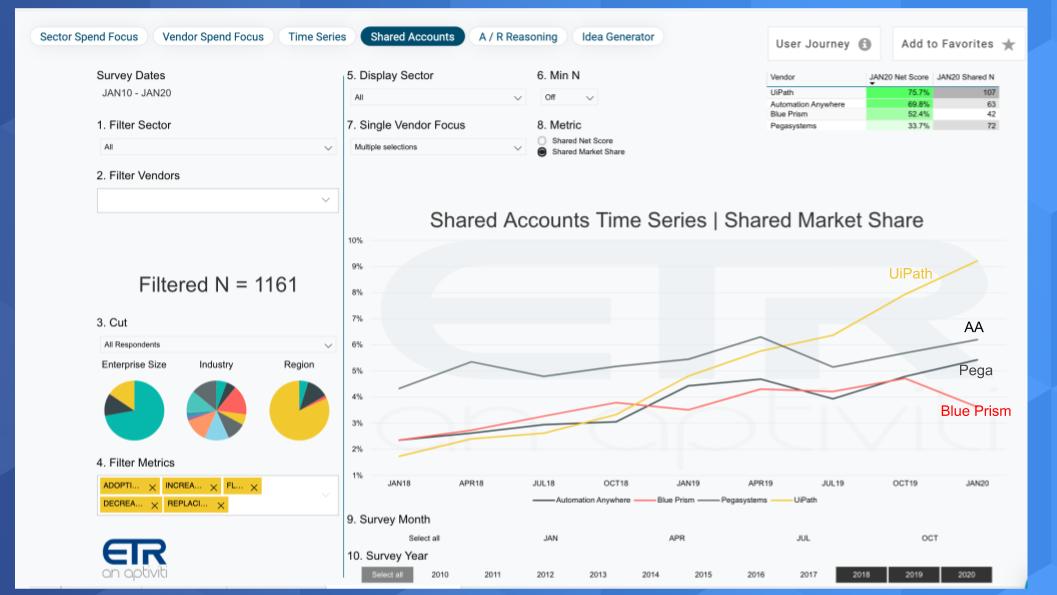
How is “Market Share” Changing Over Time?
Finally, lets look at what ETR calls Market Share which is a measure of pervasiveness in the survey. It is calculated by dividing the number of mentions of a specific vendor’s solution by the total responses in a particular market segment. The chart below shows data from all one thousand plus respondents and you can see again, UiPath appears to be breaking out. Automation Anywhere and Pegasystems show an uptick in the January survey and Blue Prism is trending down a little, which is something to watch…but you can see in the upper right – all four companies are in the green with regard to Net Score or spending velocity which is a positive or the sector.
Summarizing the RPA Market Analysis
Is this market over hyped? Probably but is it over valued? We don’t think so. The customer feedback we have in the community and the proof points are stacking up. With continued revenue growth and eventual profits you could make the case that the player which comes out on top will really do well and see huge returns. Let’s come back to that in a moment.
How large is this market? I think it can be very large – a TAM of 30 billion plus is not out of the question in my view. That realization will be a function of RPAs ability to break into more use cases with deeper business integration. RPA has an opportunity to cross the chasm and deliver low code solutions to subject matter experts in business lines that are in a strong position to drive change.
Many people poo poo this notion of low code or “citizen developer,” but we think it’s something that is a real possibility. The idea of hyper automation is buzz wordy but it has meaning. Companies that bring RPA together with process mining and machine intelligence to drive process analytics has great potential…IF organizational stove pipes can be broken down. In other words put process data and analytics at the core to drive decision making and change.
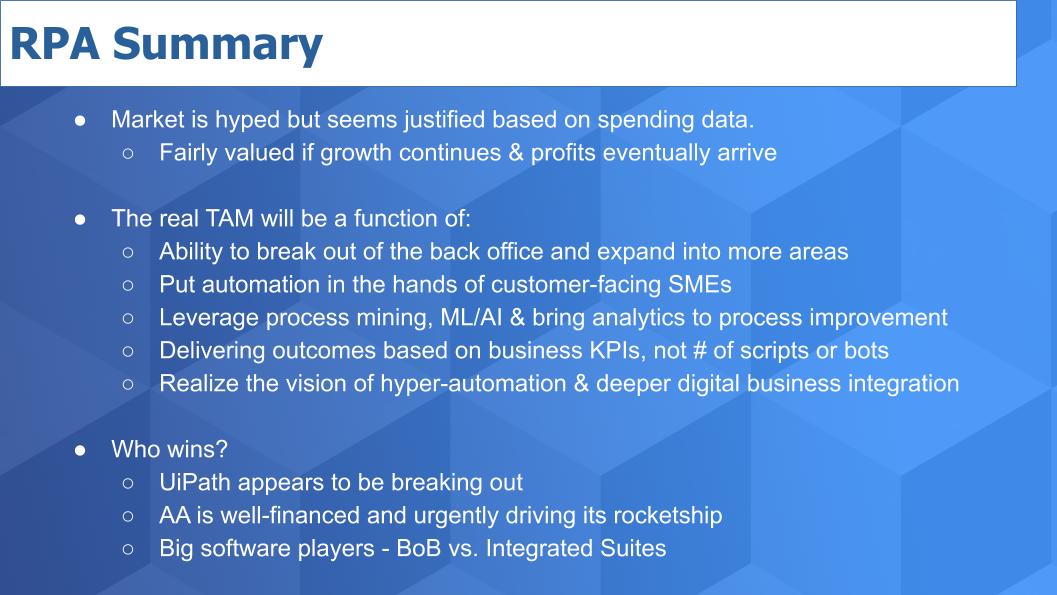
Who wins? Here’s our prediction. The company that breaks out and hits escape velocity is going to make a lot of money in this market. Unlike what we said last week in our cloud computing Breaking Analysis – this is more of a winner take all market. Its’ not a trillion dollar TAM like cloud. It’s tens of billions and maybe north of $30B but it’s somewhat of a zero sum game market in our view.
We think the number one player will make a lot of money. Number two will do okay and we think everyone else will struggle for profits.
Now the wildcard is the degree to which big software players like Microsoft and SAP poison the RPA well. Here’s what we think. In our view, these big software players are taking an incremental view of the market and are bundling in RPA as a checkoff item and feature of their bundled suites. They will not be the ones to drive radical transformation. Rather they will siphon off some demand as a matter of convenience, but organizations that really want to benefit from so-called hyper automation will be leaning heavily on software from specialists who have the vision, resources, culture and focus to drive digital process transformation.
As always, we really appreciate the comments we get on our LinkedIn posts and on Twitter @dvellante so thanks for those. Also, you may want to check out this ETR Tutorial we created, which explains their spending methodology in more detail.
Finally, here’s the full video analysis of this week’s segment: