Contributing Author: Erik Porter Bradley
Recent survey data from ETR shows that enterprise tech spending is tracking with projected U.S. GDP growth at 6% to 7% this year. Many markers continue to point the way to a strong recovery including hiring trends and the loosening of frozen IT project budgets. However, skills shortages are blocking progress at some companies, which bodes well for an increased reliance on external IT services. Moreover, while there’s much talk about the rotation out of work from home plays such as video conferencing, VDI and other remote worker tech, we see organizations still trying to figure out the ideal balance between funding HQ investments that have been neglected and getting hybrid work “right.” In particular, the talent gap combined with a digital mandate means companies face some tough decisions as to how to fund the future while serving existing customers; and transforming culturally.
In this Breaking Analysis we welcome back Erik Bradley, Chief Engagement Strategist at ETR, who will share fresh data, perspectives and insights from the latest survey data. We’ll also drill into some of the vendor names and share thoughts on those companies with momentum, those that don’t show well in the data and what it all means for the future. We have a particular emphasis this week on the changing observability space with a drilldown into Splunk, Zoom and Pure Storage.
The Macro Picture
Spend Momentum Accelerating
First we’ll share some top line data and then dig into some of the highlights from ETR’s most recent March COVID survey and the latest April spending data.
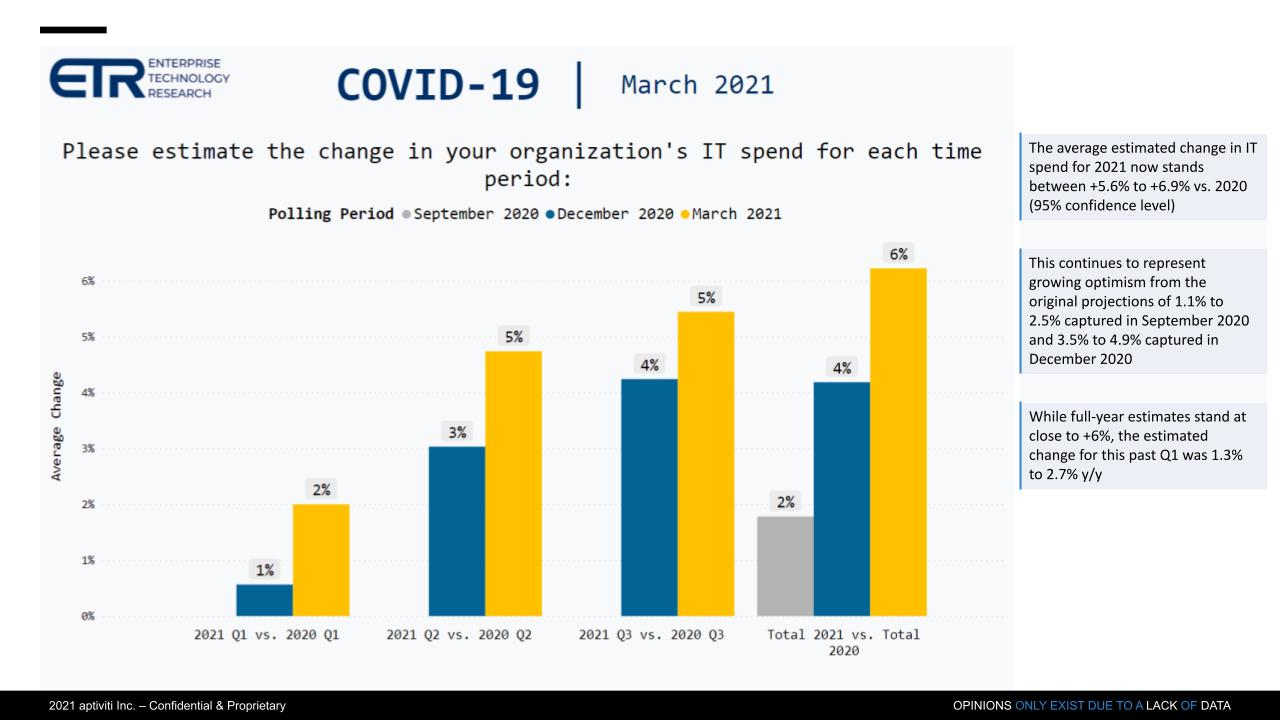
The graphic above shows data from the most recent ETR COVID survey. It depicts CIO and IT buyer responses to expected IT spend for each quarter of 2021 vs 2020. And you can see here a steady quarterly improvement, leading to our forecast of 6-7% growth in 2021.
According to Erik Bradley, this ETR survey had a record setting number of responses with over 1500 IT decision makers participating. This is the seventh iteration of the COVID impact survey and this is going to transition to an even larger macro survey going forward.
The ETR COVID survey dates back to March of 2020 and is designed to better understand how spending is being impacted by COVID?
What we’re seeing is a midpoint of around 6.7% growth and that appears to be accelerating. So we are expecting that spending is going to be strong in the second half of the year.
Watch Eric Bradley’s commentary.
CIOs are Relaxing COVID Defensive Actions
Respondents were asked which strategies they’re employing in the short term as a result of Coronavirus and you can see in the graphic below see a few notable factors. First, there’s been no meaningful change in tactics like remote work support and halting travel. However we’re seeing very positive trends in other areas measured as downward momentum in hiring freezes, freezing IT deployments and layoffs. We also see an increase in new IT deployments and hiring.
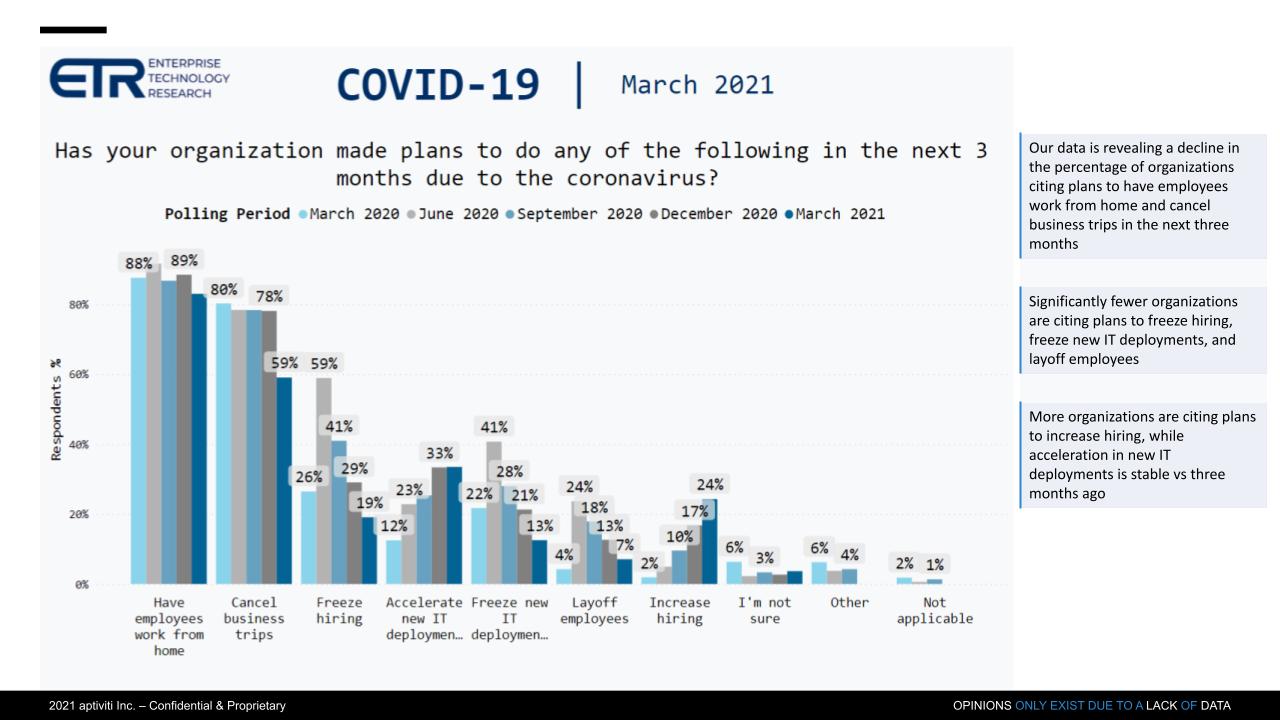
According to Erik Bradley, it’s important to point out here that we’re also capturing that people believe remote work productivity is still increasing. While the trajectory might be coming down a little bit, that is a key backdrop to what’s happening here. Specifically, people have a perception that productivity of remote work is better than being at the office every day.
And the data is telling us that organizations want to continue to accelerate IT deployments and support work from home and a hybrid, but they just don’t have the skills to do so.
Watch Erik Bradley’s comments.
Balancing Cloud & HQ Needs is a Double Positive for Tech
The chart below shows data from ETR’s COVID survey that asks respondents how a return to the new normal and back to offices will affect their spending between cloud and on-prem architectures and applications. The first two bars are cloud friendly – 63% of respondents say that either they’ll stay in the cloud for the most part or they’ll lower on-prem spend.
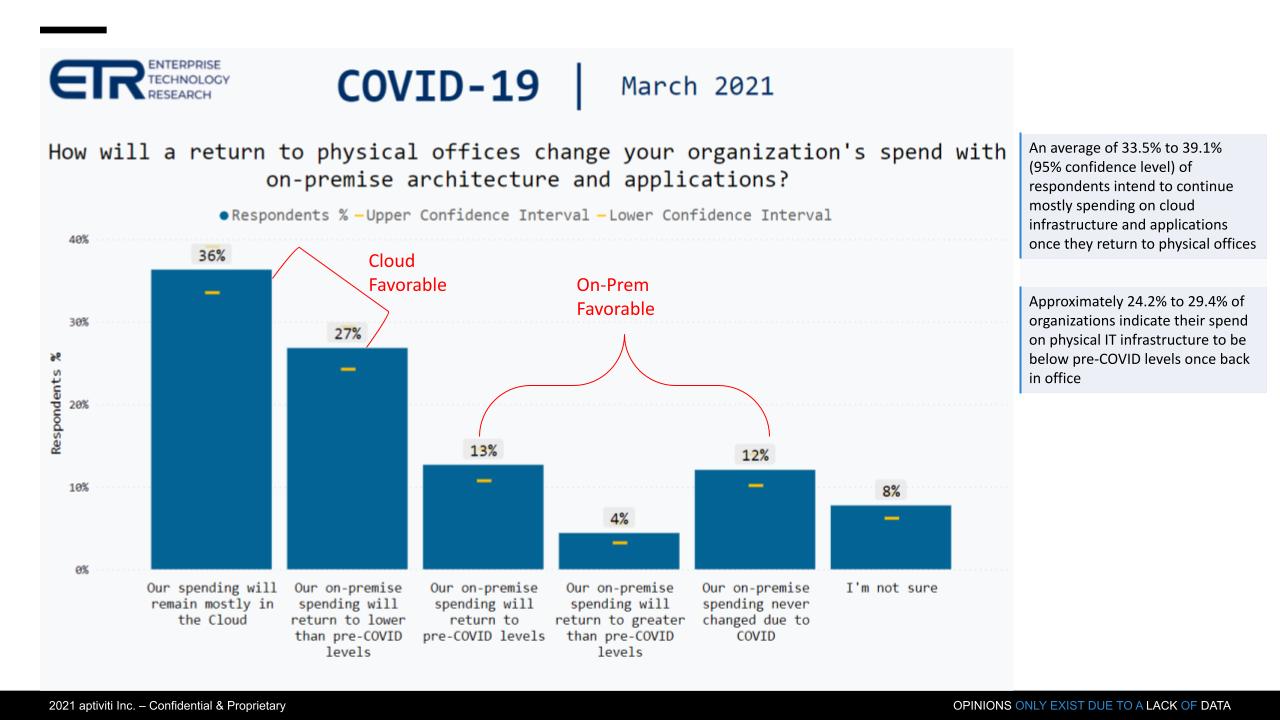
The next three bars are on-prem friendly, where collectively, 29% of respondents say their on-prem spend will bounce back to pre-COVID or actually increase…12% of that number by the way said they never altered on-prem spend. No big surprise that this bodes well for cloud. However, the data is also a positive for on-prem. We have put forth a dual investment premise— meaning while cloud continues to grow, neglected data center spending also gets a boost as organizations must invest more to maintain and improve resiliency, while at the same time funding digital initiatives.
According to Erik Bradley, organizations are spending on all fronts. They’re fighting a naval, air and land battle, meaning they’ve got to spend on cloud and digital transformation, but also they need to invest for on-prem and an emerging hybrid work model is coming that needs to be supported. So this spending is going to increase.
Moreover, there are refresh cycles coming up. So overall it just points to more and more spending right now. It really does seem to be a very strong backdrop for IT growth.
Watch Erik Bradley’s comments.
Sector Momentum – IT Services Accelerates, Video Conferencing Slowing
The next chart below breaks down the ETR taxonomy in simple to understand terms – the green is the portion of spending on a vendor’s tech within a category that is growing and the red is the portion that is decelerating.
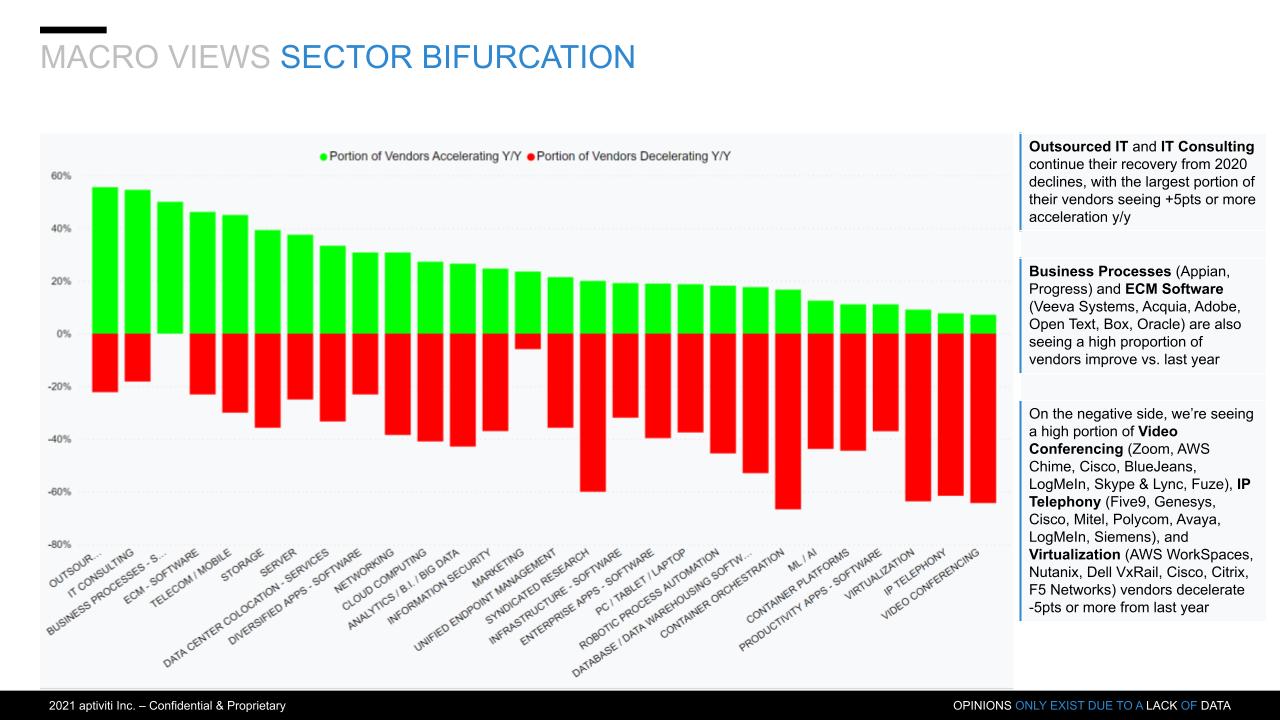
ETR uses a methodology called Net Score. According to Bradley, it’s a proprietary formula used to determine the overall velocity of spending. This chart shows how many of the vendors are increasing versus decreasing within a sector.
What we’re seeing here goes back to something we called out last year in our predictions and that was that IT services and consulting was going to have a true rebound in 2021. And that’s exactly what this is showing above. 2020 had a lot of declines in services, the largest sector in IT. And now it’s showing the biggest year over year acceleration for any sector.
The other thing to point out, and we’ll get to this later in the post, is that the inverse analysis is true for videoconferencing.
Watch Erik Bradley’s comments.
IT Services Momentum Underscores the Talent Shortage
The chart below is a drilldown into the IT services sector and emphasizes our thesis regarding the skills gap. And we saw this in IBM’s Q1 earnings report, where still more than 60% of IBM’s business comes from services. The company beat earnings in part due to services outperforming expectations – but it’s not just IBM. The data shows across the board strength for professional services leaders.
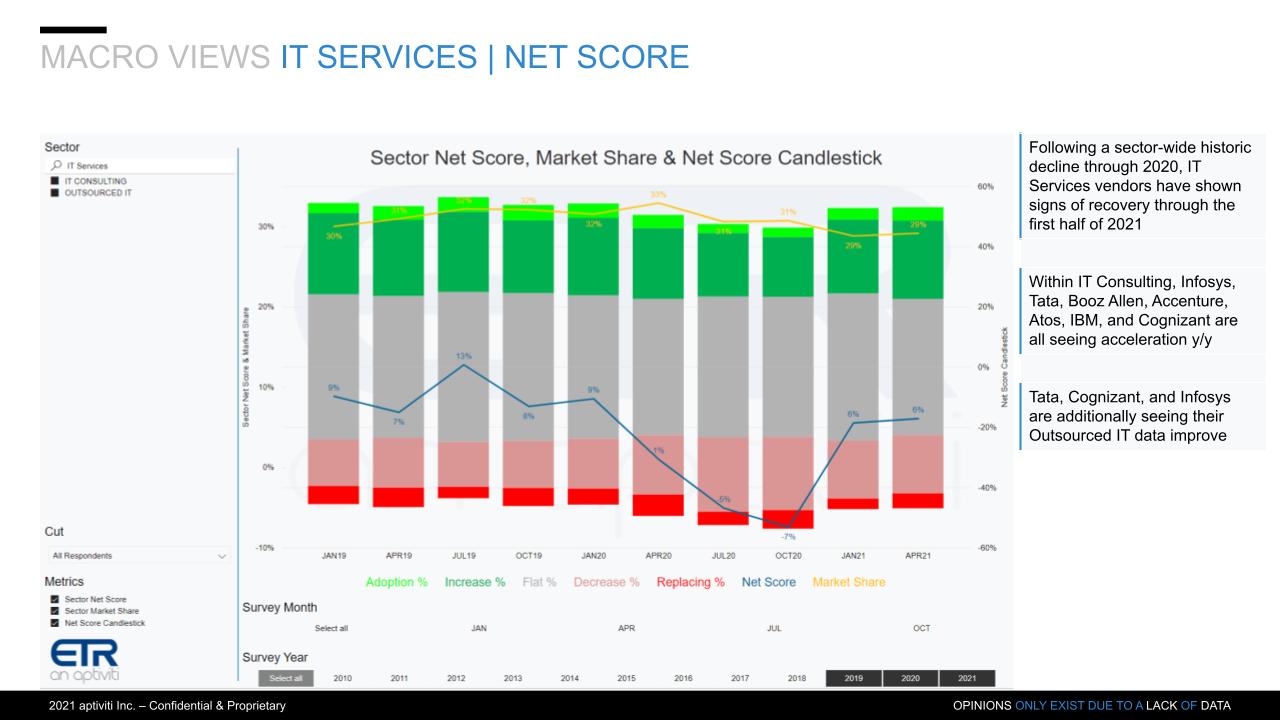
The chart above is a candlestick that shows the breakdown of ETR’s Net Score methodology. The lime green is new deployments, the forest green is increased spend, the gray is flat spending, the pink is decreased spending and the bright red is decommissioning.
The blue line tracks Net Score, which subtracts the red from the green. You can see it went negative in 2020 as budgets were tightening. And it bounced off the bottom in the October survey and has risen sharply.
The yellow line is Market Share, which is a measure of pervasiveness in the ETR data set. Notably, services has a high market share because as a sector, collectively it is the largest IT market.
But it’s not just IBM showing strength in services. According to ETR’s Bradley, Accenture, Tata, Infosys, Cognizant and other services companies are well positioned for a rebound.
Watch Erik Bradley’s commentary.
The Battle for Talent has Started in Earnest
The chart below asks respondents to comment on their staffing plans. The light blue indicates increasing staff, the gray is no change and the magenta is decreasing. The picture is positive across the board whether full time staff, offshoring, contract employees and outsourced professional services. All pointing to more evidence of bounce back in IT services.
However it also signals higher wages and fees.
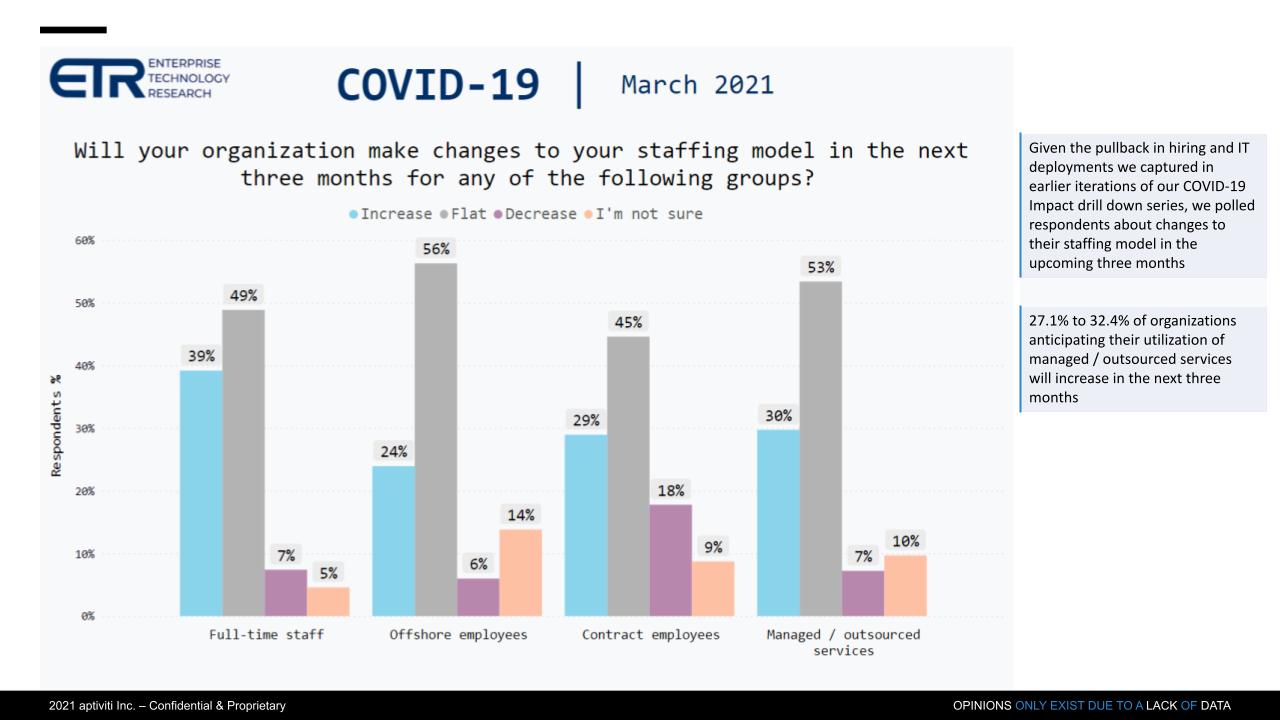
Bradley explained to theCUBE that when ETR caught this trend, they decided to go one level deeper and understand why this was happening. So ETR went back and asked respondents to provide additional color on their staffing strategies. Multiple priorities are tugging at the staff strings of IT and there’s just a real skills shortage. So this is a long-term setup that bodes very well for IT services a consulting.
Watch Erik Bradley’s commentary.
A Bifurcated Vendor Spending Picture
The chart below looks at positive versus negative sentiment on companies based on the ETR data. First, it’s important to note how ETR derives this data. Then we’ll look at some of the takeaways.
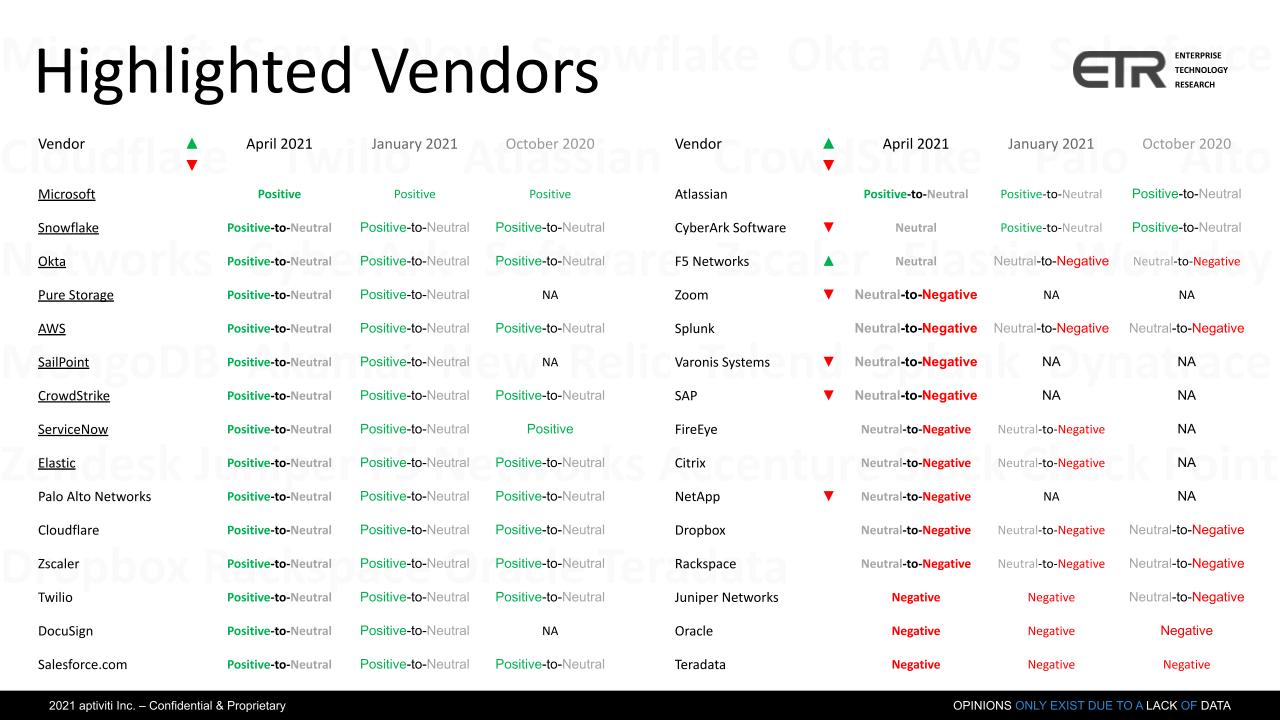
The data above comes from systematic survey responses that ETR takes on a quarterly basis. These responses are standardized to allow for a time series analysis so we can do trend analysis. As well we do find that ETR data is forward-looking at spending intentions and is really more predictive because we’re talking about things that might be happening three months in the future, not things that already happened.
The positive and negative sentiment are based on a relative change in Net Score momentum from previous quarters.
It’s also important to point out that the survey captures top-line revenue and is not indicative of profit margin or any other line items on the income statement or balance sheet. So this data measures momentum in that context relative to previous surveys. Negatives are derived by monitoring deceleration whereas positives show increased spending momentum. As it pertains to stock prices and valuations, performance relative to expectations is what matters more than absolute spending data.
For example, take the example of Oracle. It has such a large presence in the market that it doesn’t take much to move the needle into positive territory. The stock is trading at or near its all-time highs because of the momentum it has in cloud. So the street is rewarding Oracle for the investments it has made in cloud and software over the past decade and is recognizing its dominant position in mission-critical software markets.
Similarly, NetApp, while showing deceleration in the ETR data set, has reset expectations with Wall Street analysts and has done a good job of communicating its outlook and can beat those lowered projections. As such its stock, which was beaten down in 2019 due to lack of execution and 2020 due to COVID has shown strong since last fall.
Vendor Commentary
Some of the names in the green above we’ve been tracking in previous Breaking Analysis episodes. Microsoft’s ubiquity and strength are probably the most impressive in the data set. Snowflake’s positive momentum and ability to “hold serve” at a what are some of the highest Net Scores in the data set is also notable.
Okta, CrowdStrike and Zscaler are four-star security firms that we first highlighted as breakout companies in 2019. We’ve also reported on the struggles of Palo Alto Networks’ transition to cloud but predicted a bounce back because CISOs view it as a gold standard and thought leader in the cybersecurity space. We will do a deeper dive in cyber soon with our quarterly security update.
Pure is trending well in the data set and we’ll explore that later in this post. We’ll also do a drill-down on Zoom.
We’ll talk in detail later in this post about Elastic, Splunk and the shifting sands in the observability space. Elastic, the creators of the ELK stack, present an open source alternative to Splunk. As well the entire application performance management/monitoring space (APM) is evolving with established players colliding and new entrants trying to usher in a next generation software approach. But the space is crowded.
Splunk is in transition from an on-prem license model to a SaaS play. Its acquisition of SignalFx was designed to expand its TAM (total available market) and provide a stronger recurring revenue model. But Splunk’s struggles extend further into go to market and that’s a big reason it hired former AWS executive Teresa Carlson. Carlson built the highly successful AWS Public Sector business and is an extremely strong go to market pro. She has her work cut out as Splunk is in a dog fight to hold on to existing customers that are experimenting with lower cost alternatives, while at the same time helping transform Splunk and set the stage for the next ten years.
Watch Erik Bradley’s commentary.
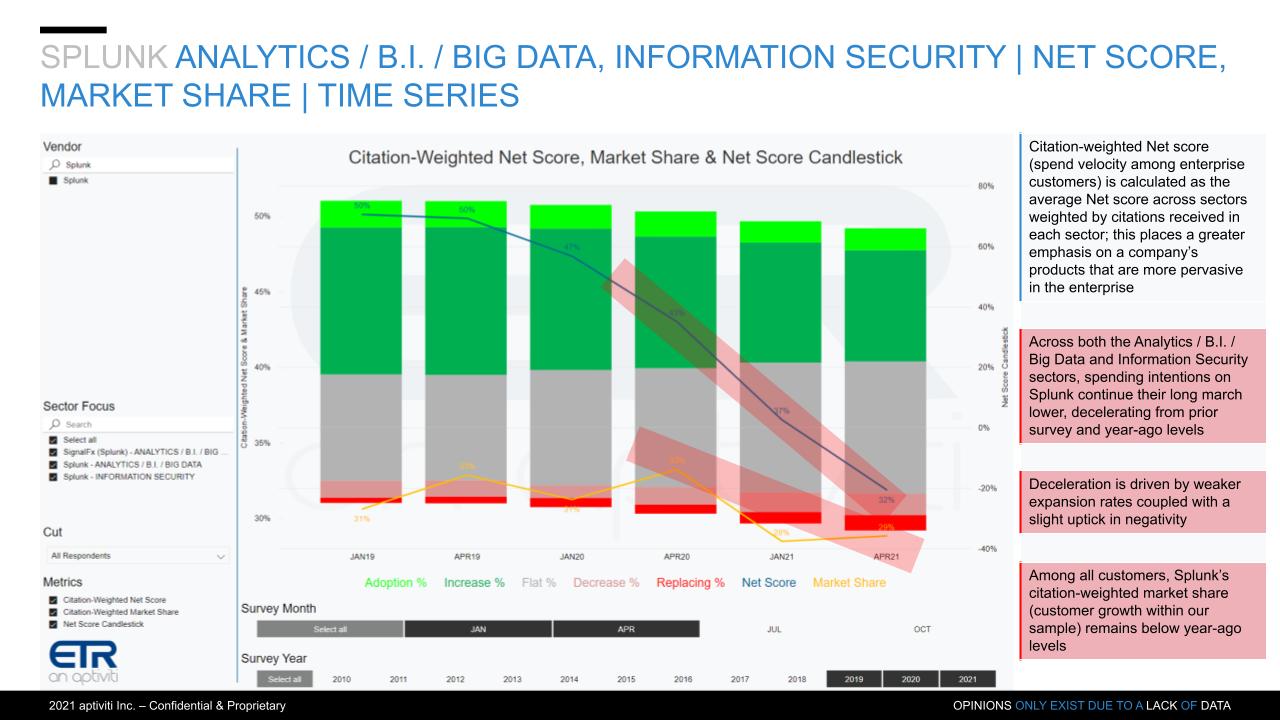
Splunk Drilldown
Splunk in Analytics, Big Data & Security
Below is the data on Splunk in analytics, big data and security combined. It hasn’t been trending in the right direction for the past several quarters. The green is accelerating spend, the Red is decelerating spend, the top blue line is spending velocity – or Net Score and the yellow line is market share or pervasiveness in the data set.
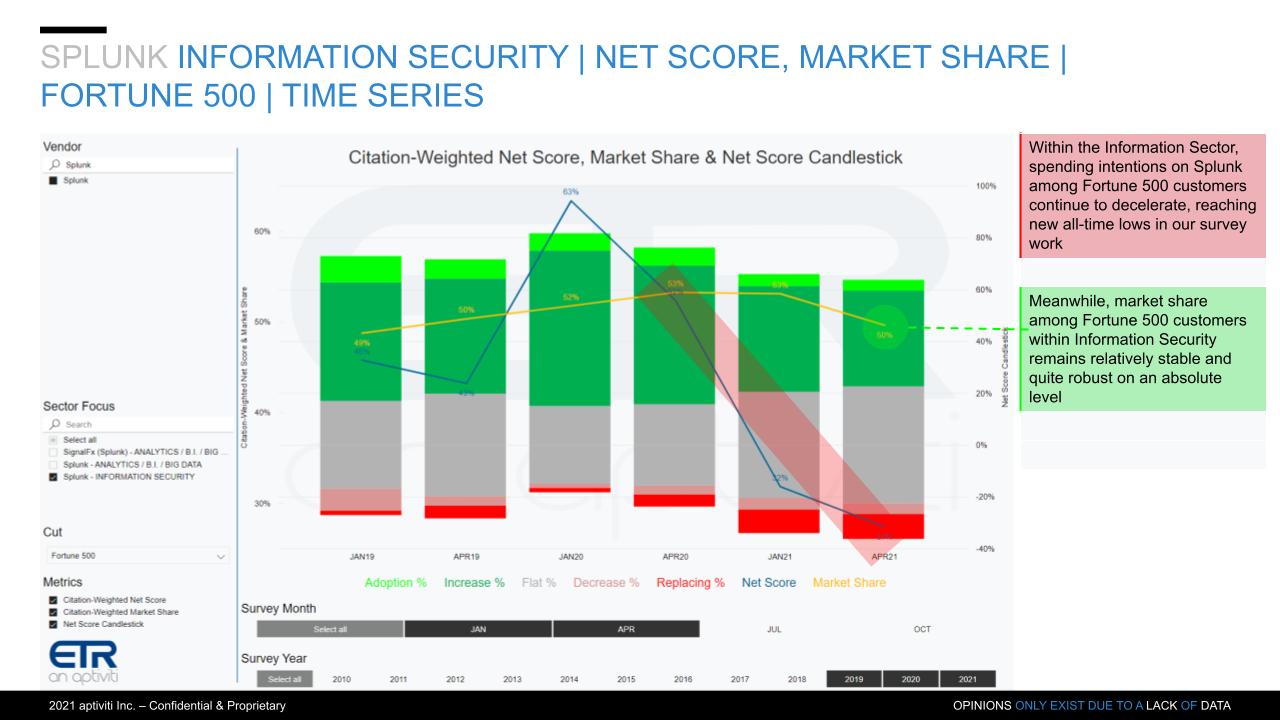
Splunk in Security
Here’s the same data view on Splunk but isolated in the security sector, a mainstay of Splunk’s business. Many customers have been vocal to us about Splunk’s pricing being too high but as we’ve always said, if that’s your biggest challenge you’re in good shape.
Watch Erik Bradley’s commentary.
Splunk in Elastic Accounts
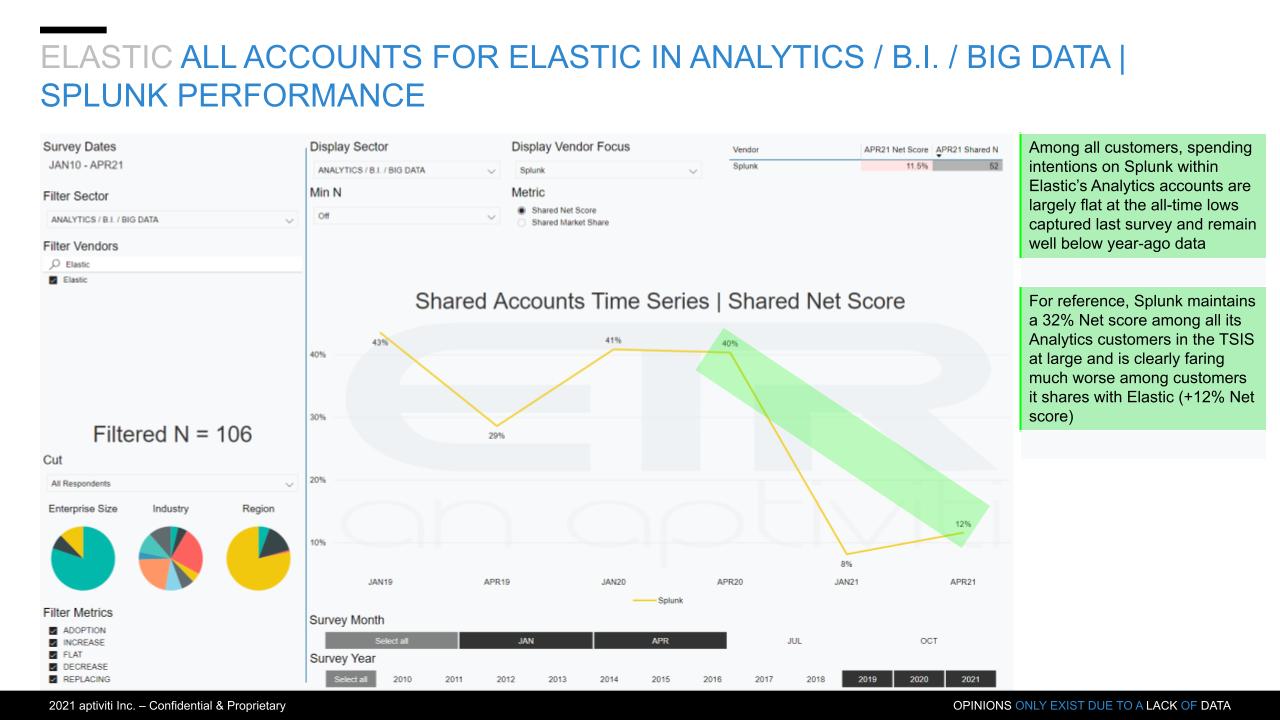
For years we heard vendors talk about how they were introducing the “Splunk Killer.” It never happened and Splunk thrived. But cloud native, new pricing models and the ELK stack have clearly put pressure on Splunk. Elastic has targeted Splunk and is having success.
The chart below shows the Net Score for Splunk in Elastic accounts for analytics. There are 106 Elastic accounts in the ETR data set that also have Splunk and it’s trending downward for Splunk that’s why it’s green for Elastic. And the important call out from ETR is how Splunk’s performance in Elastic accounts compares with its performance overall– i.e. within Elastic accounts, Splunk’s Net Score is in the red at 11.5%, versus 32% overall.
Application Performance Management Transitions to Observability
We’ve been covering the APM space pretty extensively and the chart below lines up some of the big players. In this data we compare the Net Scores or spending momentum from the April 20th survey (the gray bar), Jan ’21 survey (blue bar) and the April ’21 survey (yellow bar). Not only are Elastic and Datadog doing well relative to Splunk but everything is down from last year so this space is undergoing a transformation.
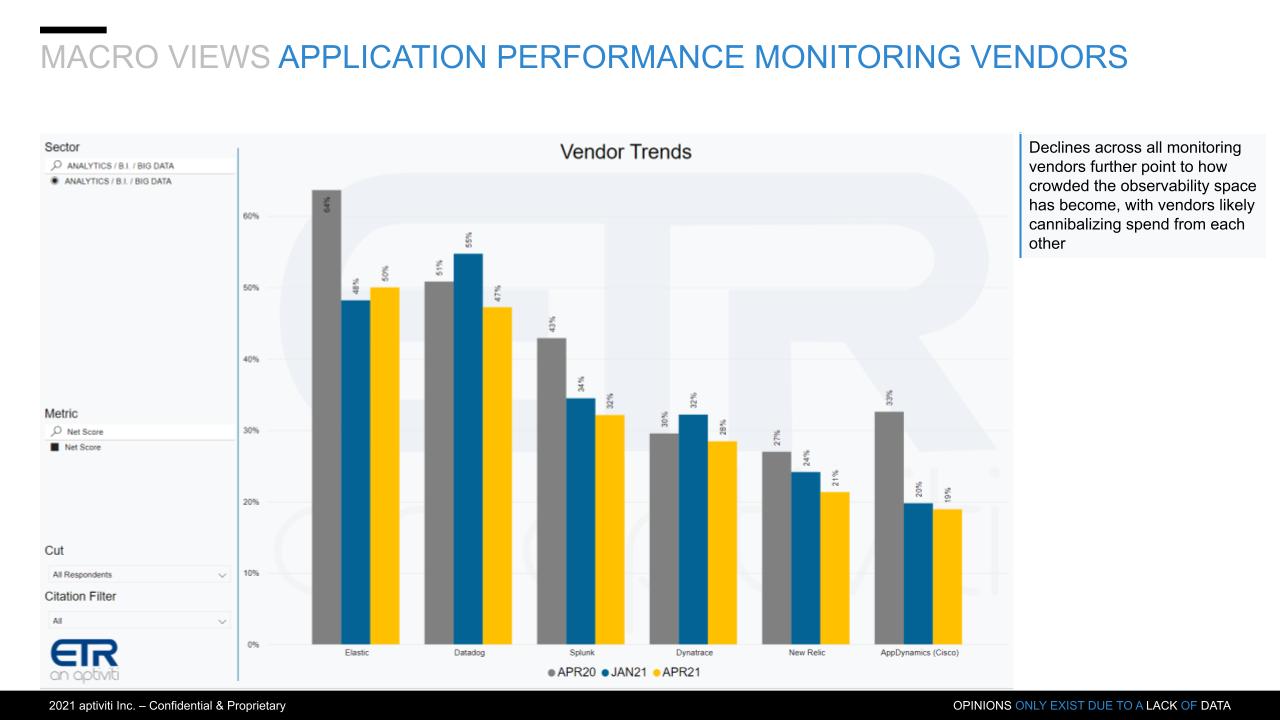
In addition, Splunk must contend with Dynatrace, seen by CIOs as a leader with a strong roadmap, New Relic, which has an excellent, purpose-built database, designed specifically for APM and Cisco’s acquisition of AppD, which is performing well.
We also see new entrants trying to disrupt the space including ChaosSearch, Honeycomb and Observe.
Watch Erik Bradley’s commentary.
The Upside for Splunk
As we’ve reported, Splunk, like Tableau before it, has had to transition its product to be cloud native. Splunk has created an open API framework and re-built its platform with microservices, The SignalFx acquisition brought a cloud native offering, with an ARR model that positions Splunk for the monitoring space. Splunk has made other acquisitions to shore up its offering and pivot to observability, including Omnition (tracing), Phantom (security orchestration), and VictorOps (automated alerting).
Splunk is in the midst of a transition to become a fully cloud-based observability platform and set the stage for the next generation of the company. The Teresa Carlson hire was a missing piece to the puzzle and we think these moves set up well for Splunk’s future as it continues to evolve its product line. It’s now ready to go to market with a new story.
The observability space is crowded and Splunk needs to move fast. The upshot is its established customer base is significant (more than 12,000), those customers are passionate and many are loyal to Splunk.
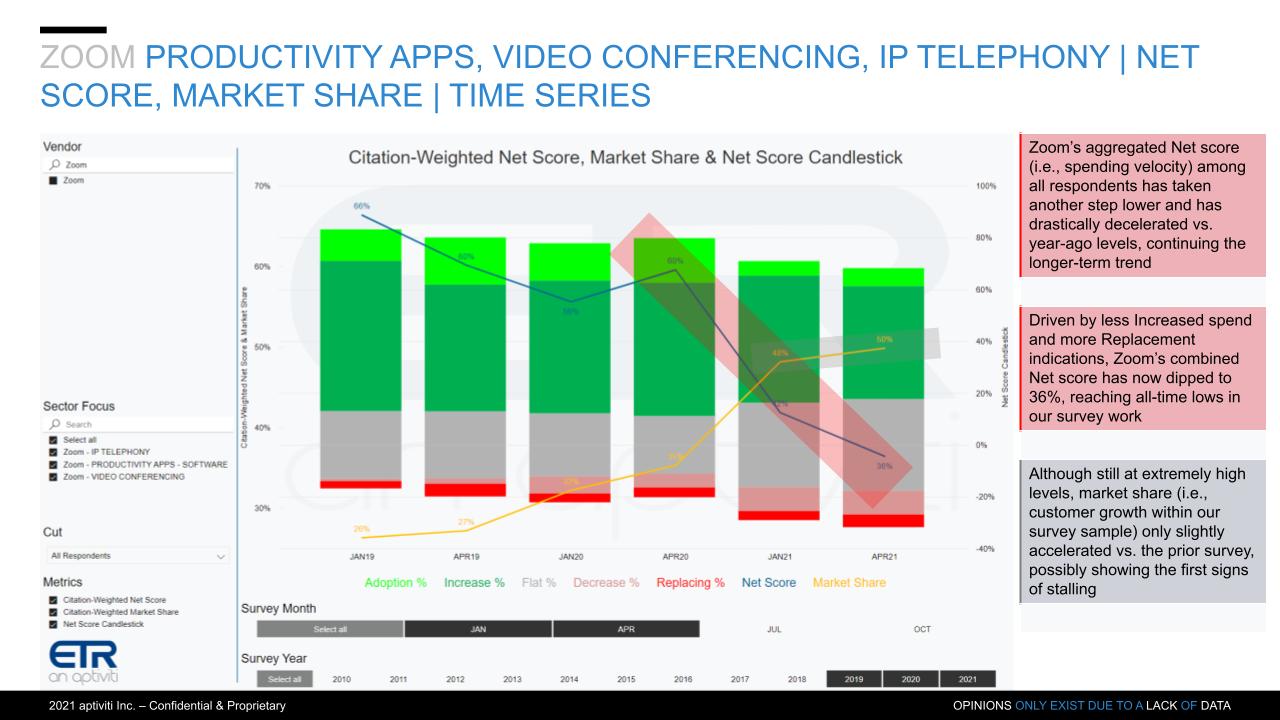
Is the Ride Over for Zoom?
Zoom was one of the most, if not the most, prominent momentum name in the isolation economy. Pre-COVID its stock price was just over 100 and by mid-October it peaked at over 550. The darling of the isolation economy, as shown below, is seeing a marked deceleration in Net Score spending momentum. In addition, anecdotally, ETR Venn discussions indicate many organizations are relying on the free version of Zoom. So Zoom has to: 1) Successfully transition customers from free to paid; and 2) Use its elevated market capitalization to expand its TAM.
Watch Erik Bradley’s commentary.
Is Pure Storage a Harbinger of a Rebound in the Sector?
The data below shows a strong momentum uptick for Pure Storage, rebounding from its 2020 lows. We’ve highlighted a number of times that this company is showing elevated spending intentions lately. Pure announces earnings in May and while its growth has been outpacing competitors over many of the past several quarters (not all), it has not returned to its former prominent growth rates. We’re watching closely to see if this data signals a breakout for the company and the sector.
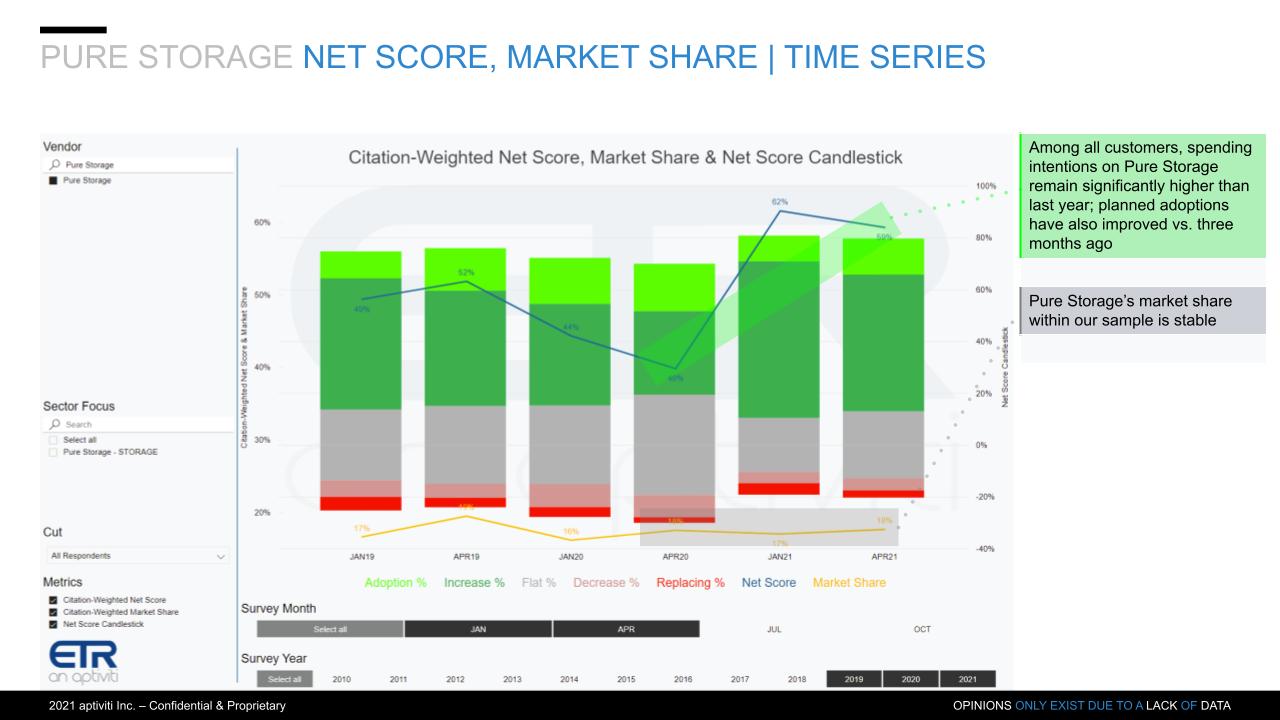
Will Storage Return to a Positive Growth Sector?
The chart below lays out the storage players. Storage has been a tough market for the reasons we’ve highlighted in previous segments– cloud competition and flash headroom. One note: ETR combines primary and secondary storage into a single category so you’ll have companies like Pure and NetApp in the sector along with Veeam, Cohesity and Rubrik.
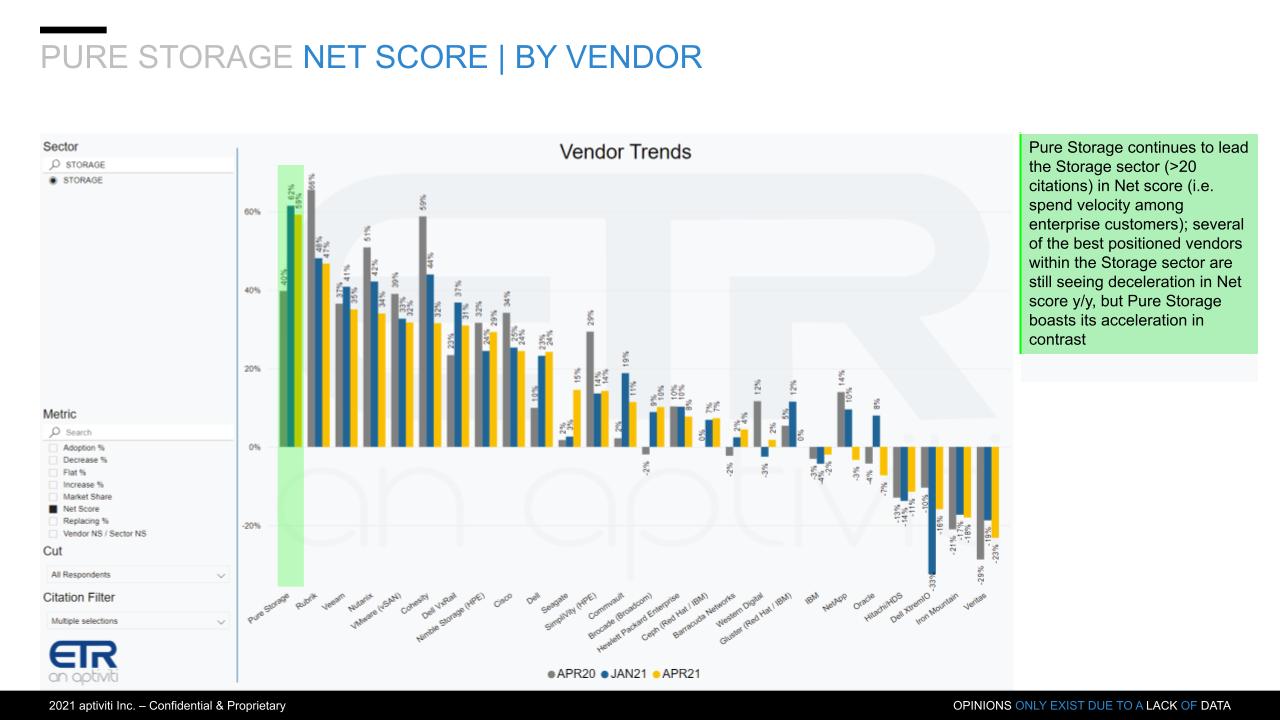
Pure is elevated and remains the “one eyed man in the land of the blind” within the storage sector.
Rubrik’s Net Score is elevated but down off its hight. Big competitor Cohesity is well off its Net Score highs. To us, Veeam is the consistent player in the data protection space. The Veeam data is steady and the company continues to execute well.
Dell is also notable to us. The company’s storage business has been struggling. Dell’s ISG business, which comprises on-prem servers and storage, has been soft during COVID. Dell has had a storage refresh and product rollout so it’s notable to see the uptick in Dell within this survey. Because Dell is so large, a small uptick can be very good for the company.
As well, HPE has a big storage announcement coming next month so that might improve the company’s performance based on a product cycle refresh. Of course HPE’s Nimble brand continues to do well in the ETR survey, but it’s only part of the portfolio.
IBM just announced and storage had a very soft storage quarter – down double digits. IBM storage is in a product cycle shift. NetApp looks soft in the ETR data from a spending momentum standpoint but its management has been transforming the company into a cloud play and we like much of what they’re doing – NetApp, other than Pure is the only other big pure play player in the primary storage sector.
Storage is transforming to cloud and cloud native services. Also container-based storage services are small but growing as containers increasingly require management and persistence. On-prem as-a-service models are emerging (e.g. HPE GreenLake & Dell Apex.
Despite the flash injection pressuring traditional storage sales (i.e. customers used to be forced to buy spindles to increase performance), anecdotal data suggests a flash refresh cycle is coming as existing systems are coming off depreciation.
Summarizing the State of Tech Spending
Tech spend appears to be tracking U.S. GDP at 6-7%. We think there is upside to this projection as normally technology outpaces GDP by 1-2 percentage points. However with continued uncertainty in the market, we’re comfortable with a figure that tracks GDP.
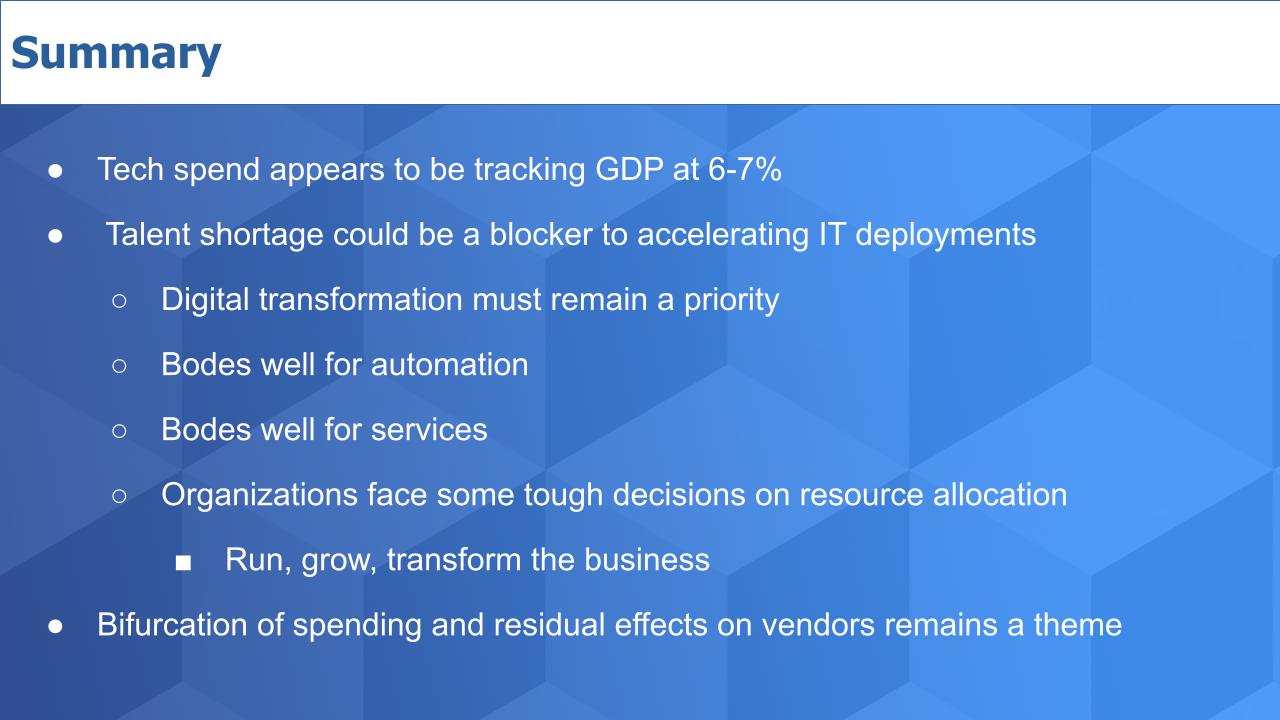
The noted talent shortage could be a blocker to accelerating IT deployments. However, digital transformation must remain a priority and that is a positive for a continued strong automation trend as well as professional IT services.
Customers must continue to balance spending on digital transformations, supporting remote workers and investing in corporate networks and related infrastructure. This could propel our 6-7% spending forecast even higher as companies simultaneously invest in running, growing and transforming their organizations.
But the rising tide doesn’t necessarily lift all ships as the survey data continues to show a bifurcation in the vendor landscape between those well-positioned in cloud, automation, cyber security transformation, modern data analytics and associated services and those that aren’t.
Watch Erik Bradley’s final thoughts with some important comments on acceleration in mid- and small-sized accounts.
Keep in Touch
Remember these episodes are all available as podcasts wherever you listen.
Email david.vellante@siliconangle.com | DM @dvellante on Twitter | Comment on our LinkedIn posts.
Also, check out this ETR Tutorial we created, which explains the spending methodology in more detail.
Watch the full video analysis:
Image credit: Sikov
Note: ETR is a separate company from Wikibon/SiliconANGLE. If you would like to cite or republish any of the company’s data, or inquire about its services, please contact ETR at legal@etr.ai.